Championing the changemakers
BuildingGreen champions the changemakers in sustainable design and building, with trusted insight, unparalleled education, and communities that are transforming the industry.
Log in to your profile

BuildingGreen champions the changemakers in sustainable design and building.
BuildingGreen is the essential source where trusted insight resides, knowledge is shared, unparalleled education takes place, and thought leaders interact in transforming the sustainable building movement. As champions of the leaders driving meaningful change within and across the movement, we advance the progressive edge between a healthy & resilient built environment and a thriving, equitable world. That makes us your most effective partner in building excellence, furthering your career and offering supportive, encouraging communities.
Join, learn, and participate: Subscribe to our online resources, join our professional peer networks, hire our consulting team.
Recent Content
How to Use the Right Tools to Design for Climate Change
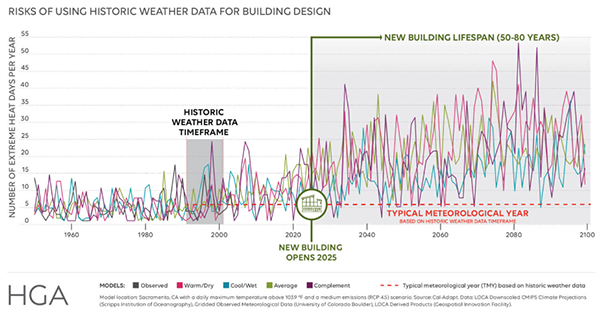
Weather files that help designers plan for climate change will soon be readily available. But legal liability remains until ASHRAE catches up.
Read More
On-demand Water Heat Goes All Electric with Heat Pumps, CO₂

Intellihot electrifies commercial water heating using heat pumps, CO₂ refrigerant, thermal batteries, and no need for water storage.
Read More

3 First Steps to Break the Chains of Slavery in the Supply Chain
Forced labor and other inhumane practices are embedded in many common building materials. The building industry can’t solve this alone, but we can still take action.
Read More
Outdoor Lighting: How to Balance Energy, Ecosystems, and Equity

The best outdoor lighting is efficacious but warm and meets the performance needs of the application without disturbing wildlife or people.
Read More
Inflation Reduction Act Collection: Guidance & Case Studies

The IRA may be revolutionizing green building. Learn how to leverage this generational funding to curtail carbon and elevate equity.
Read More
Amid a Silicosis Surge, We Need to Rethink Countertops
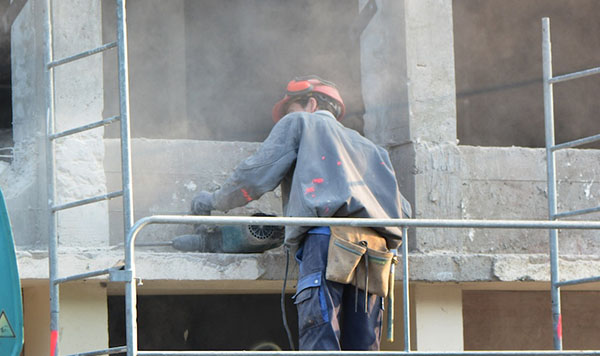
Engineered stone countertops may be causing a spike in lung disease, with cases seemingly tied to the material’s unique properties. Find out what design and construction teams should do—and why.
Read More

How can BuildingGreen help you?
Product Category Guidance
Our editors have prepared more than 100 concise guides to choosing green products.
Product insights
Access our Insights
Bring BuildingGreen’s knowledge, guidance and facilitation onto your team.
Find out how we can help