Blog Post
Cool Tool for Dealing with Stack Effect
In 2003, as part of their presentation (“Ventilation Myths and Misconceptions”) at the Affordable Comfort conference, Collin Olson and Paul Francisco debuted a software tool they developed called SEE STACK. (If you want to experiment with the software, you can safely click here to download the virus-free executable file and training manual from The Energy Conservatory).
“We developed SEE STACK in no small part to demonstrate the Point Five Rule established by Larry Palmiter,” said Collin Olson of The Energy Conservatory. “The Point Five Rule states that adding exhaust or supply ventilation only adds about half of its flow to the total ventilation rate of the building under some pretty typical weather conditions.” (For a great detailed discussion on the Point Five Rule in a broader ventilation context, see Ventilation Doesn’t Happen in a Vacuum).
The SEE STACK software shows what happens to the pressure profile of a building as the delta-T (difference between indoor and outdoor temperature) changes and as mechanical ventilation — supply or exhaust — is introduced to small buildings.
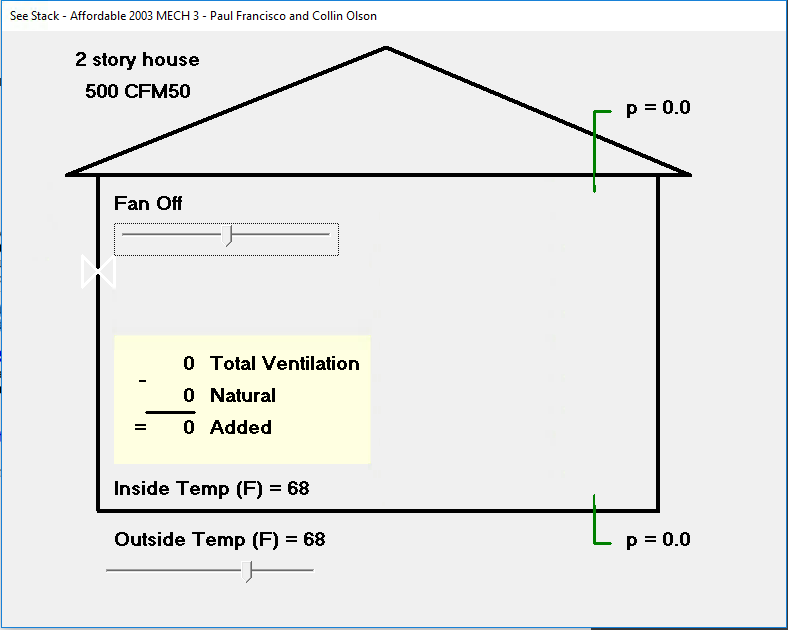
Note the slider for the fan (off, as shown), and the slider for the Outside Temp (same as Indoor Temp, as shown). The pressure profile of the building is uniformly 0 Pascals (Pa) because there are no pressure forces working on this building.
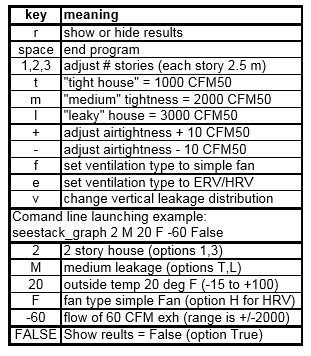
This table is the keystroke legend for making changes to SEE STACK.
If at this point you have downloaded and opened both the SEE STACK executable file and the training manual, you can see what a great educational resource it is. But what about using it in the field?
SUPPORT INDEPENDENT SUSTAINABILITY REPORTING
BuildingGreen relies on our premium members, not on advertisers. Help make our work possible.
See membership options »In 2014, I got a call from central Connecticut for a leaking cathedral ceiling and kneewall attic space.
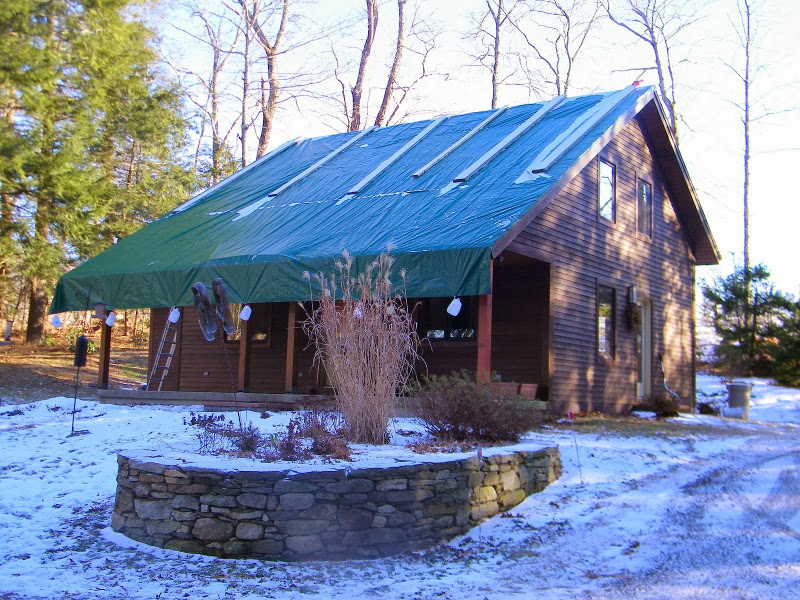
The timber-frame house in Connecticut is insulated with structural insulated panels (SIPs). Moisture is condensing and dripping from the home's roof assembly.
Enclosure details for this story-and-a-half house (28 feet by 32 feet):
- Slab-on-grade foundation
- Kneewall attic space (over the front porch)
- Cathedral roof assembly (from the exterior to the interior): asphalt shingles, #30 felt, SIP with EPS insulation, 6-mil polyethylene, 2x6 tongue-and-groove boards attached to roof timbers spaced 4 feet on center.
Mechanical systems:
- No AC
- Propane-fired direct-vent space heater
- Ventilation system: Balanced HRV servicing mostly the 2nd floor, plus spot exhaust in two bathrooms and laundry room.
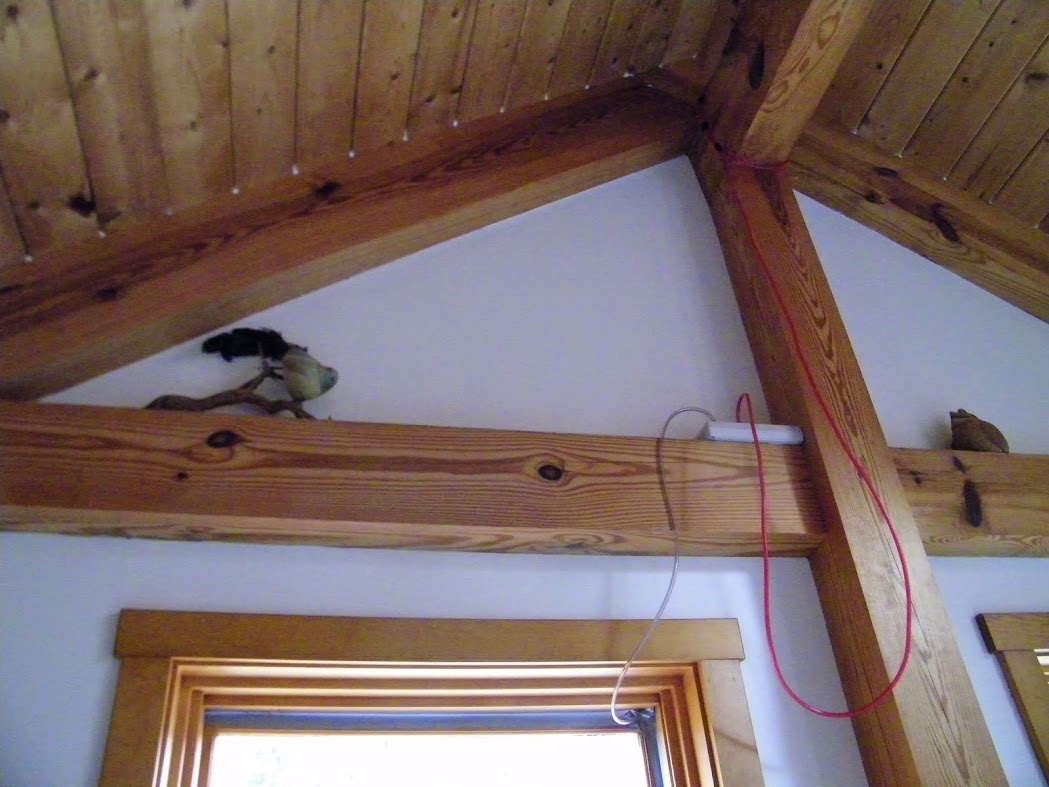
In the winter, water was leaking between the tongue-and-groove exposed roof deck boards and into the kneewall attic space.
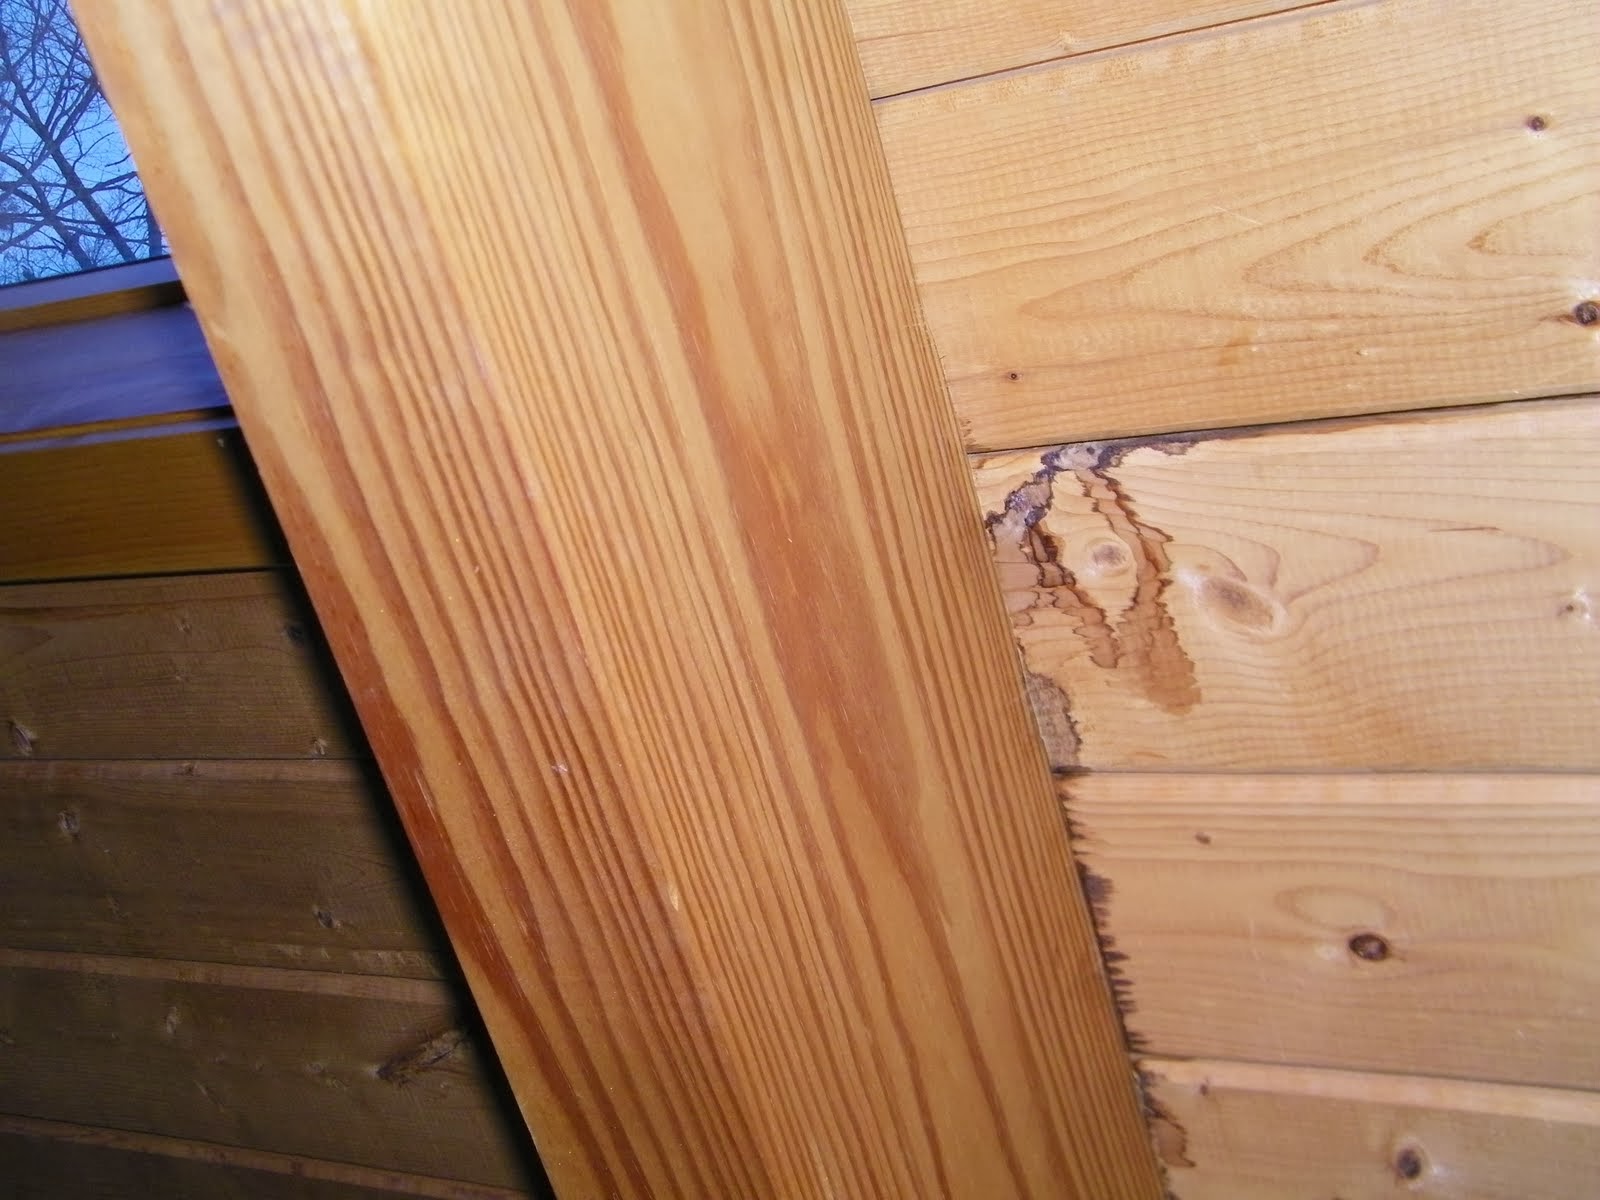
Note the water staining along the rafter and between the tongue-and-groove boards.
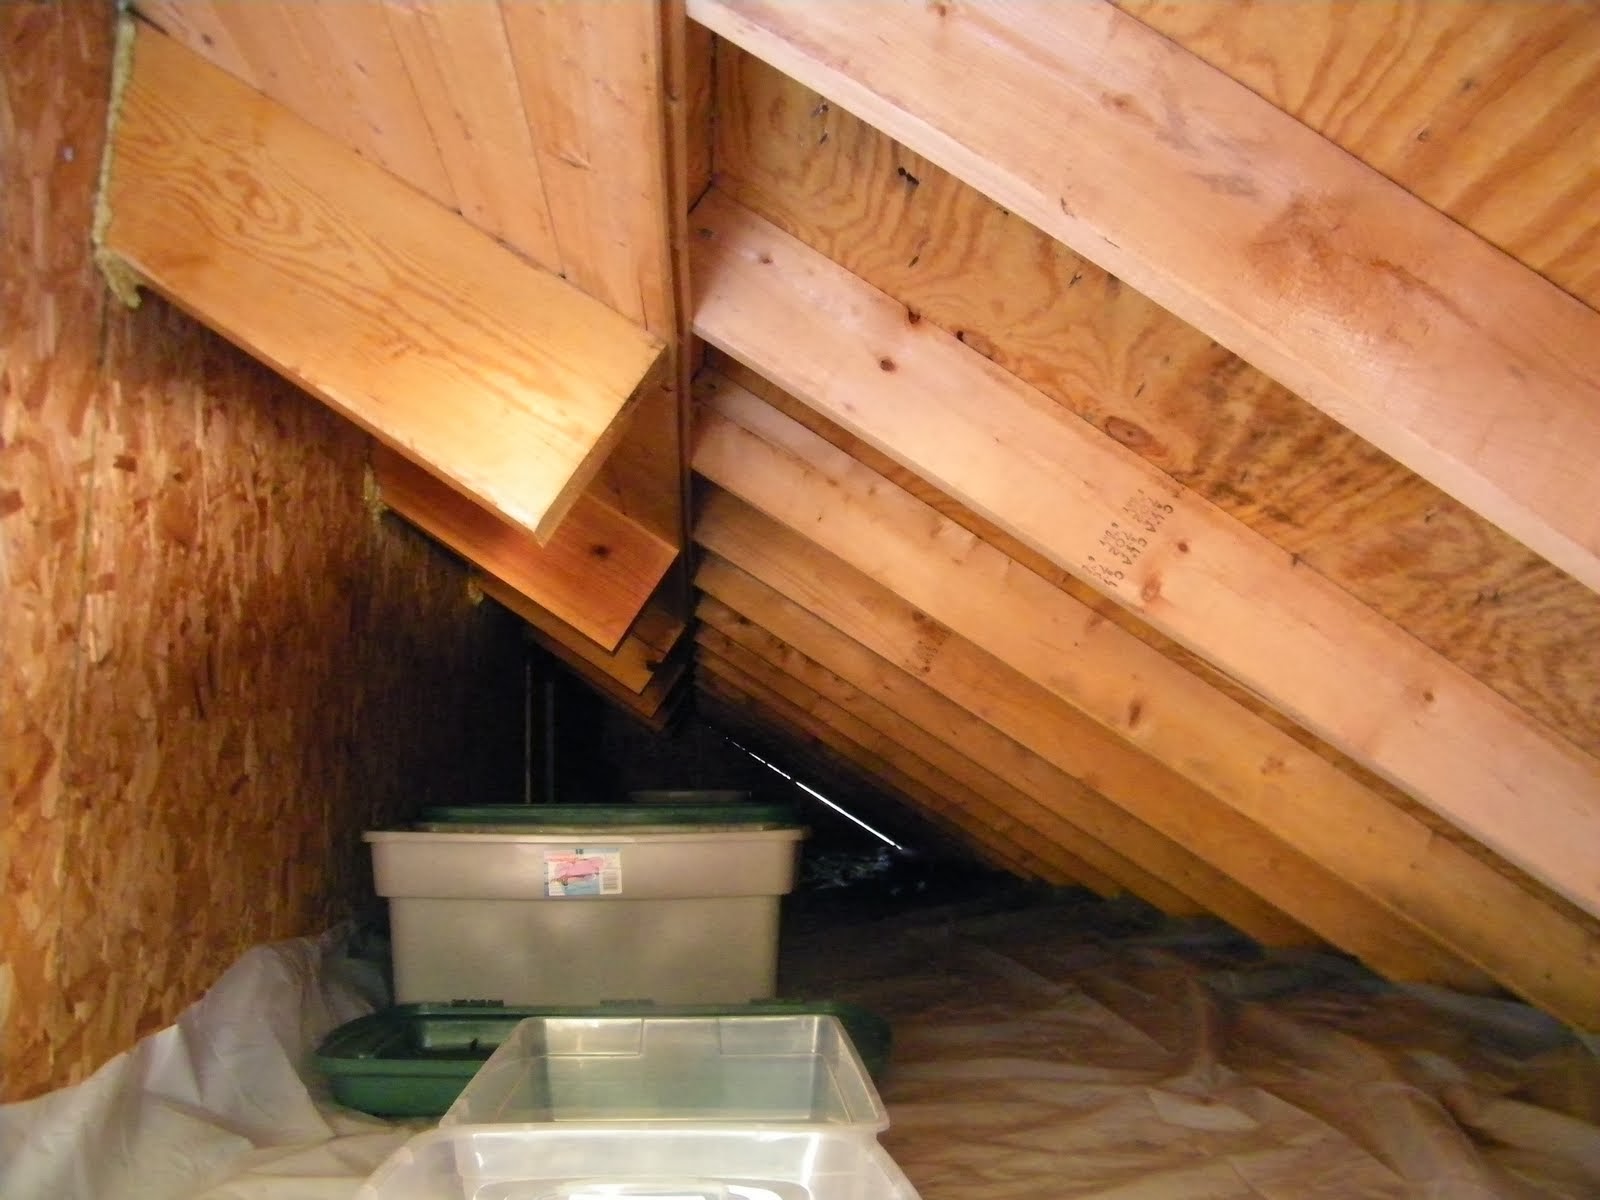
On the north side of this story-and-a-half cape, the roof is extended for a front porch facing the lake, resulting in this kneewall attic space. The attic is experiencing significant water leakage off the eaves of the timber-frame roof.
This sure looked to me as though warm moist air was leaking up into the SIP roof deck, driven by wintertime stack effect, and then condensing and running along the 6-mil poly, leaking through holes back into the cathedral ceiling but also running down the poly to where the poly terminates in the attic knee wall space.

An infrared camera (operated while a blower door is depressurizing the building) shows air leaks along the timber-frame rafters, right where the SIP joints are, exterior to the tongue-and-groove deck and 6-mil poly.

This blower-door-assisted infrared photo shows cold air leaking in at each of the tongue-and-groove roof deck boards as they extend out over the gable-end timber-frame rafter to form the gable overhang. When I got up on a ladder to the gable end roof line, there were places where you could actually see daylight along these cracks.
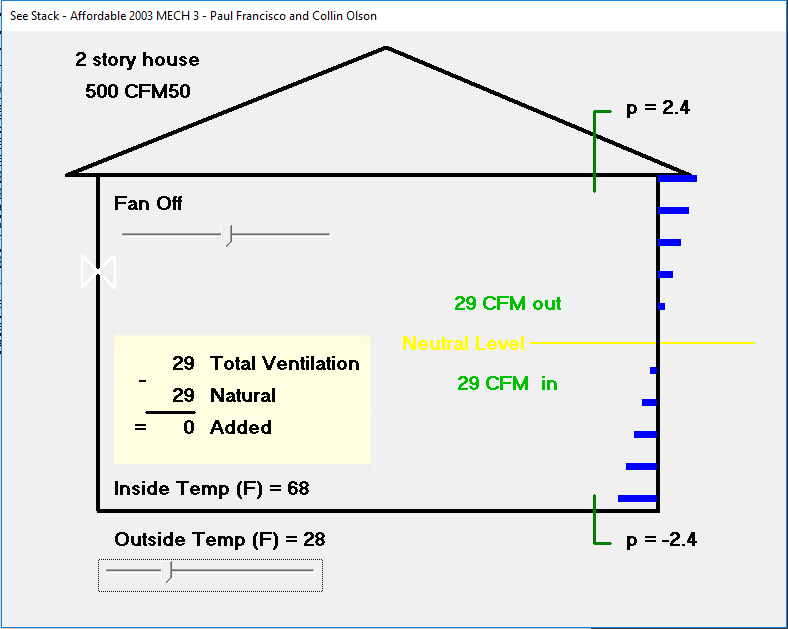
I picked a fairly common wintertime delta-T for central Connecticut (40 F°). SEE STACK shows a stack effect at the ceiling plane of positive 2.4 Pa. Note that I have set the airtightness for 500 cfm50, confirmed by a blower door test on the SIP timber-frame home. The blower door also revealed fairly evenly distributed air leaks, resulting in a setting for SEE STACK of evenly distributed air leaks along the vertical profile of the building. (I used the “v” keystroke from the SEE STACK legend above).
Why now?But why are these air leaks and the resulting condensation happening now, more than 25 years after the home was built? We confirmed that each SIP was installed with spray foam applied to butt joints as the panels were placed. We hypothesized that continual and cyclical contraction and expansion of the SIP finally resulted in hairline cracks in the spray foam in the butted panel joints.
To confirm all this, we suggested tearing up some roof cladding and inspecting the panel joints, and using a blower door to test the tightness of the SIP seams (using both positive and negative pressure). If this testing proved our theory correct, the solution would be to remove all of the roof cladding and seal the panel joints with topside high-performance pressure-sensitive tape or membrane at all panel joints.
The client balked: he had a pretty new roof and said, “Isn’t there another approach?” That is when I thought of SEE STACK: if the client could stomach the energy costs of an exhaust fan running in the winter to counter the stack effect, could we use SEE STACK to understand the pressure regimes that the home would experience over the winter and to help us correctly size the exhaust fan?
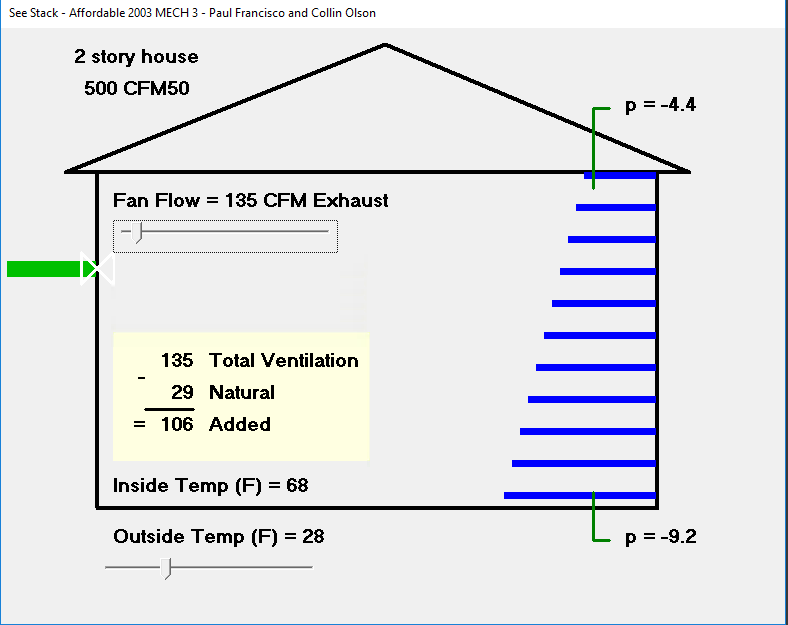
SEE STACK shows a reasonable pressure profile for the whole structure, including -4.4 Pa at the ceiling with a delta-T of 40 F° and a 135 cfm exhaust fan. The client chose a high-efficiency exhaust fan which could be set over a range of approximately 50 to 150 cfm.
SEE STACK's predictions were good
So how did we and SEE STACK do? The tables below show that the client’s exhaust fan is altering the pressure profile the same way (or very nearly the same way) as SEE STACK predicted. For the last three years, the client has had no wintertime cathedral ceiling leakage. The client adjusts the exhaust fan based on approximate delta-T— higher fan settings when it is really cold and lower when it is not. (He only operates the fan during the heating season).
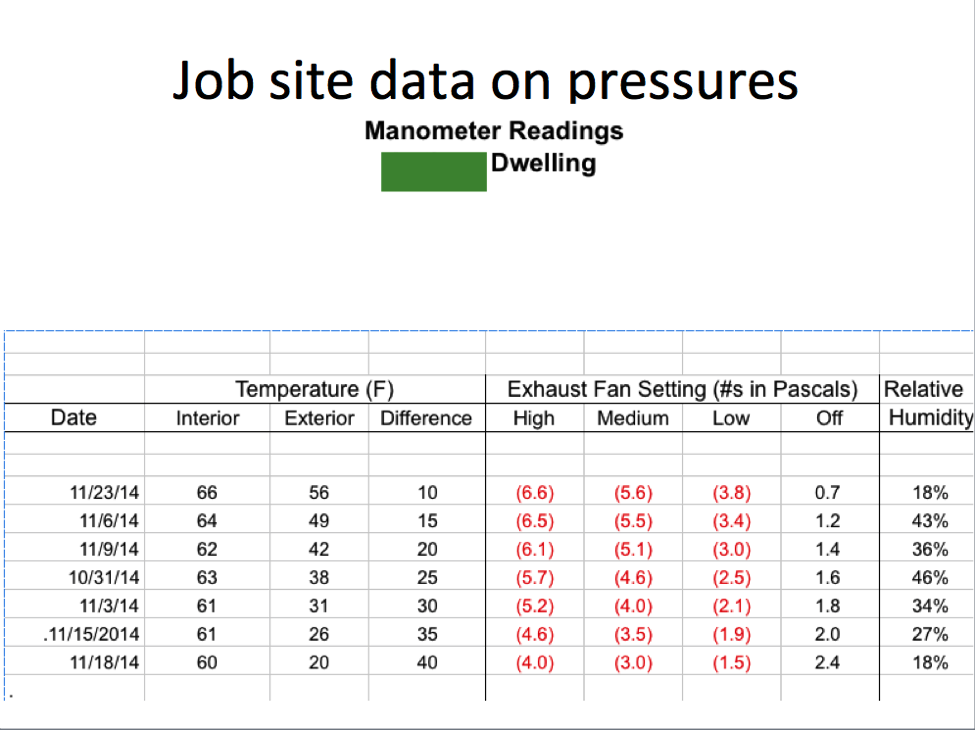
Note how the pressure reading shown in the of this table (+2.4 Pa) matches the SEE STACK calculation shown above (no exhaust fan and delta-T 40 F°) and how in the same row, the number corresponding to the column for high speed operation of the exhaust fan shows a pressure at the ceiling of -4.0 Pa, just a bit lower than the -4.4 Pa that SEE STACK calculated in the screen shot above.
The pressure gauge setup that was used to get the data shown in the table above. Note the dots of spray foam used to seal the air leaks between the ceiling boards.
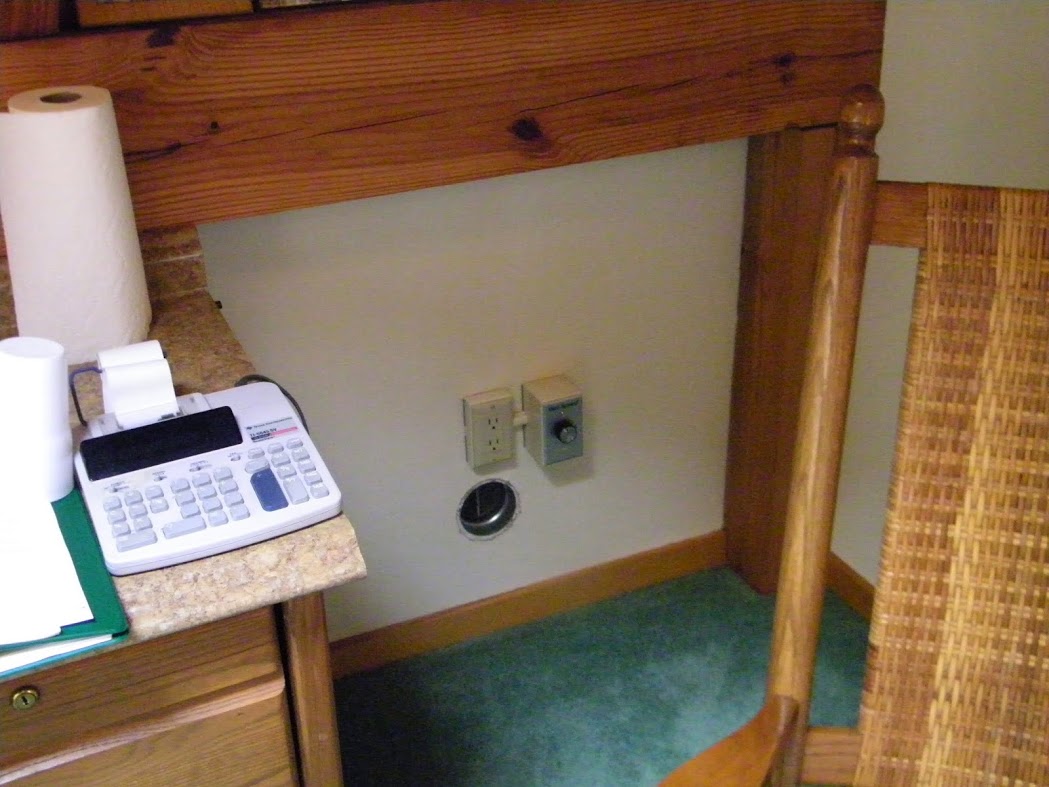
The variable-speed high-efficiency exhaust fan installed in the second floor eave wall
What about radon? What about backdrafting?
What other consequences are there when changing the pressure profile of this home with an exhaust fan? We considered two phenomena:
- Closed home with HRV off: 8.4 pC/l
- Closed home with HRV on: 2.4 pC/l
- Closed home with HRV and exhaust fan on high: 2.8 pC/l
The client and I were satisfied with these results and the client decided not to conduct longer-term radon testing.
Sorry to say that SEE STACK only works for smaller residential buildings. For larger commercial buildings, you need to use the program CONTAM, a multizone indoor air quality and ventilation analysis computer program designed by the National Institute for Standards and Technology (NIST). You can download CONTAM here: http://www.bfrl.nist.gov/IAQanalysis/software/index.htm.
A postscript from Collin Olson, one of the two developers of SEE STACK: “The name 'See Stack' is descriptive of what the program does. It was also a nod to the show 'Land of the Lost' as well as the amazing 'Sea Stacks' of the Pacific Northwest near Seattle, where Larry Palmiter and Paul Francisco were at the time.”
Peter Yost is a principal and Vice President - Technical Services at BuildingGreen, working on the design, specification, construction and investigation of both residential and commercial buildings. Peter also teaches and trains building professionals across the country. Contact Pete here.
Published January 3, 2017 Permalink Citation
Yost, P. (2017, January 3). Cool Tool for Dealing with Stack Effect. Retrieved from https://www.buildinggreen.com/blog/cool-tool-dealing-stack-effect
Add new comment
To post a comment, you need to register for a BuildingGreen Basic membership (free) or login to your existing profile.