Thank you so much for sharing these valuable tools. Do you happen to know any similar tools for international projects?
Thank you.
News Brief
Goodbye, Denial: Free Tools Expose Localized Climate Realities
The Climate Explorer and the CMRA translate nerdy climate projections into eye-opening images that should be well worth more than a thousand words in the push for resilient design.
A low-emission scenario mapped in Washington, D.C. and surrounding counties. In the upper right, two buttons allow users to explore relationships between localized climate projections and information from databases tracking climate justice and resilient-building-code adoption.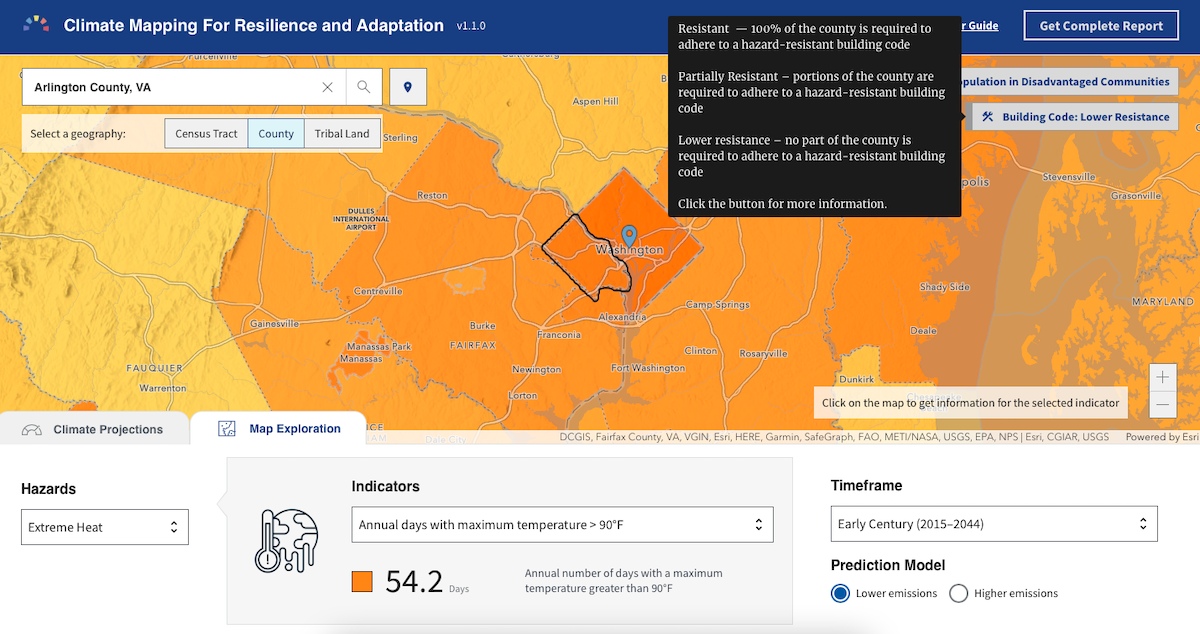
Each tool leverages downscaled, highly localized climate projections to present astonishing visualizations of what the future holds, drawing data from the representative concentration pathways (RCPs, which we explain in our primer on climate change lingo). The two RCPs considered are 4.5, a low-emission scenario but not the best case, and 8.5, the worst-case scenario.
CMRA was developed by the National Oceanic and Atmospheric Administration (NOAA) and the U.S. Department of Interior for the purpose of identifying exposure to climate hazards at the level of U.S. counties, census tracts, or Tribal lands.
The tool features plenty of buttons and knobs, comparing two different climate scenarios and displaying results for three different time periods and five different hazards—extreme heat, drought, wildfire, flooding, and coastal inundation. Users can also explore relationships between these localized climate projections and information from other federally managed tools—namely databases tracking climate justice and resilient-building-code adoption.
The Climate Explorer, also supported by NOAA but created and hosted by private-sector partners, features arresting maps whose purpose is to visualize the difference between the past and the two possible futures under consideration.
The Climate Explorer tool shows the difference between the past and two possible futures; this shows average daily temperature in summer under the high-emission scenario.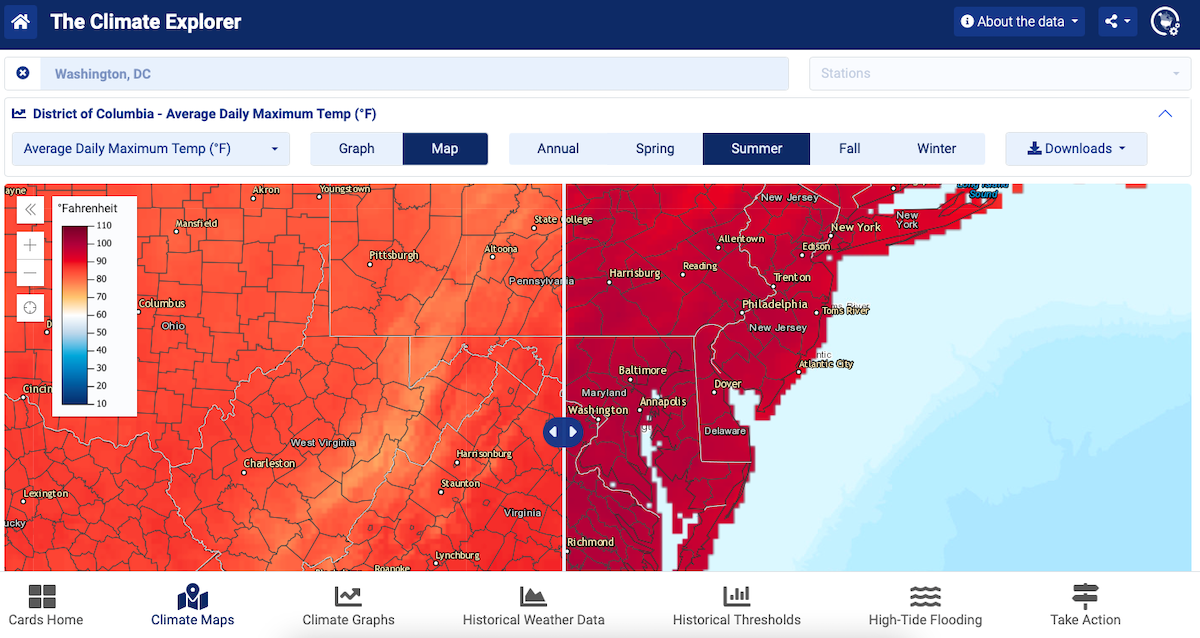
Both these tools can be used as part of a resilient design process, adding detail and granularity to considerations of hazard exposure, vulnerability, and risk at the scale of a building or an entire community.
More on resilience assessments and planning
Assessing Climate Hazards: The First Step in Resilient Design
Future Heat Waves Will Kill Power and AC—and People
Six Ways the COVID Pandemic Is Changing IAQ for Good
The IRA’s Green and Resilient Retrofit Program: Just the Basics
For more information:
U.S. Climate Resilience Toolkit
toolkit.climate.go
Published October 9, 2023 Permalink Citation
Melton, P. (2023, October 9). Goodbye, Denial: Free Tools Expose Localized Climate Realities. Retrieved from https://www.buildinggreen.com/newsbrief/goodbye-denial-free-tools-expose-localized-climate-realities
Comments
Similar tools for international projects?

Good thought, Andres!

It's hard to imagine the U.S. is leaping ahead in this area, but "international" is a big place! Do you have any specific markets in mind? I'm not familiar with all the tools, but I could do some research on options if it were a bit narrowed down.
International Tools for Climate Risk Assessment

There are some tools in larger spatial scale (e.g., city, or country level) for International locations. Check out INFORM Map Explorer, and The World Bank Climate and Disaster Risk Screening Tools.
Add new comment
To post a comment, you need to register for a BuildingGreen Basic membership (free) or login to your existing profile.