The Global Warming Potential of Insulation Materials – New Calculator
With this new tool you can see just how significant embodied energy and blowing agents are in determining the role of insulation materials in addressing climate change.
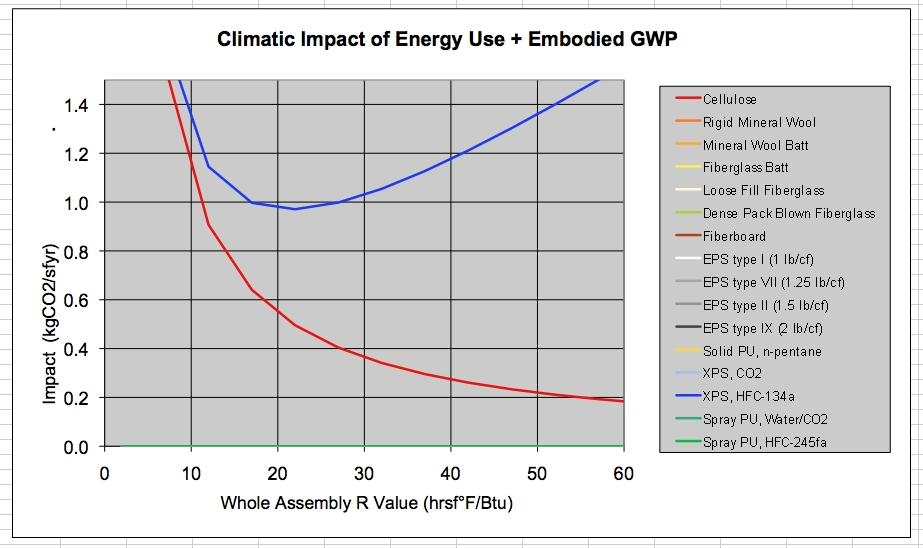
A sample output from David White's Insulation GWP Tool. See details below on how this works.
In the June issue of Environmental Building News last year, we published one of those slap-in-the-face, wake-up-call articles that forces people to rethink conventional wisdom. Most of us had long thought that more insulation was almost always better in saving energy and reducing greenhouse gas emissions. After all, the more insulation we install, the less energy gets used in the building and the less carbon dioxide is emitted.
What we long overlooked in this assumption is the very high global warming potential (GWP) of the blowing agents used in certain insulation materials. When we use foam insulation made with HFC blowing agents--specifically extruded polystyrene and closed-cell spray polyurethane foam--the more-is-better argument gets thrown out the window. That's what that EBN article, "Avoiding the Global Warming Impacts of Insulation," was about. The key points were covered in a widely read follow-up blog that's available to non-subscribers. When I wrote that article and produced the original charts on the GWP "payback" for these insulation materials (with help from Daniel Bergey and John Straube at Building Science Corporation), I had to make a lot of assumptions: how much blowing agent is released, where the building is located, the starting R-value of the building enclosure, efficiency of heating equipment, and so forth. The results got the idea across, but they had a lot of limitations.
Enter David White, a Passive House consultant from Brooklyn, New York. His company, Right Environments, has been developing some cutting-edge Passive House projects in New York City. He is also a deep thinker--and great with numbers.
David took the basic mathematical framework of the analysis we had done and packaged that into a sophisticated Excel spreadsheet that allows the user to modify variables and look at a bunch of different insulation materials. Clear graphs are produced that make it easy to draw conclusions from the information. It's an amazing calculator. And, thanks to David, we're making it available at no cost on our website.
SUPPORT INDEPENDENT SUSTAINABILITY REPORTING
BuildingGreen relies on our premium members, not on advertisers. Help make our work possible.
The Insulation GWP Tool graphs show that with most insulation materials, there are diminishing benefits of added insulation thickness (or R-value), but more insulation still reduces total GWP. (It is the embodied energy of producing that insulation that results in this diminishing benefit.) With extruded polystyrene (XPS) and standard closed-cell spray polyurethane foam (SPF), however, the graphs show very clearly how adding more insulation can significantly worsen the global warming profile of the insulation.
In creating this calculator, David (with a little help from professor Danny Harvey, who wrote the original journal article that brought this concern to our attention, John Straube, myself, and several in the chemical industry) dug deeply into the underlying assumptions about how much blowing agent is used in these insulation materials, what happens to the blowing agent over time, and various performance issues. Because the results are influenced significantly by assumptions on how quickly the blowing agents will be lost from the insulation--and because we don't really have good answers about this--the calculator allows you to change those assumptions.
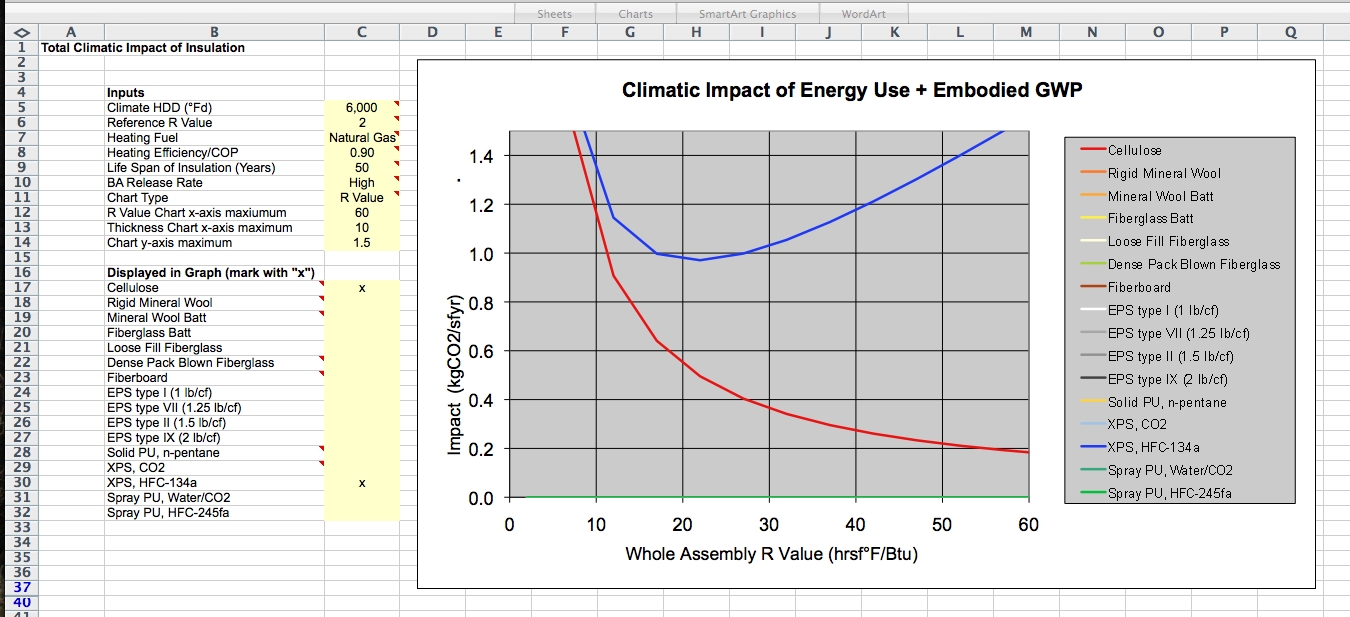
The calculator provides lots of flexibility. If you'd rather work in metric than inch-pound (I-P) units, no problem; there's a separate worksheet for each. Pay particular attention to the first sheet, which explains how the calculator works, and provides notes.
The same graph as above, but showing the specific assumptions, on the left. You can check which insulation materials you want to compare, and you can change the underlying assumptions.
The example shown here gives a sense of how this calculator can inform decision-making. Two different insulation materials are compared: XPS and cellulose. You can select and deselect insulation materials to include or exclude them from the results. On the x-axis is shown whole-wall R-values, from zero at the left side to R-60 on the far right. On the y-axis is shown greenhouse gas emissions in kilograms of carbon dioxide equivalent per square foot (don't worry about those units). We can see that as the amount of cellulose in the wall increases (higher R-value) the total greenhouse gas emissions of the wall-assembly drops. So, relative to global warming potential, the more insulation the better--at least up to R-60 (given the assumptions we plugged in to the calculator).
With XPS, though, the results are very different. Increasing the R-value reduces total greenhouse gas emissions only up to about R-20, with these assumptions. This means that if your goal is to reduce the risk of global warming, then adding much more than about 4 inches of XPS doesn't make sense--again, given the assumptions. Even in adding that R-20 does much better, relative to GWP, if we use a different insulation material--as can be seen by selecting different insulation materials. If we double the life of the insulation (building) to 100 years, the XPS does better--because there's more time to amortize the embodied GWP. If we assume the building is in a colder climate (say 9,000 degree days) or is using a less efficient heating system, more XPS will also be better, while if the climate is warmer (say 4,000 degree-days), the XPS looks worse. If we increase the "starting" R-value (assuming, say R-18 with cavity-fill insulation in a 2x6 wall), it will only make sense to add about an inch of XPS (with the default assumptions for climate, heating system efficiency, and such). In the calculator, you can change only the cells highlighted in yellow; others are fixed.
You can download the Insulation GWP Tool here. Be aware that it uses macros. With Excel 2008 for Mac, these macros do not work at all (nor do any macros). With all other versions of Excel, you may need to change your macro security level (under Tools: Options: Security) to "Medium" to allow these macros to work. They are not necessary for the tool to work properly, they are just to help you quickly set the chart's scales.
We would like to continuously improve this tool, so please let us know of any bugs you find or recommendations for enhancements you have--using the comments field below. What would make this more useful to you?
Wilson, A. (2011, March 21). The Global Warming Potential of Insulation Materials – New Calculator. Retrieved from https://www.buildinggreen.com/blog/global-warming-potential-insulation-materials-new-calculator
Thanks for the response. Some of the wood fiber insulation suppliers are claiming a negative GWP for their products. From what I have seen their in-house math does not account for the GWP of shipping the materials across the Atlantic ocean. I understand that none of the materials account for shipping in this chart, but if the chart could be updated to include wood fiber and other factors that impact the selections it would be helpful.
Bill Walsh from the Healthy Buildings Network presented some of info on insulation material selections at the PHMASS Symposium last year- but there was not a lot of data tied to their ranking system
They are not including wood fiber on their rankings either - but they are including Cork
If David Wright has time to update his chart, I think a lot of people could make use of it when navigating the information the sales reps are providing.
I don't believe that David Wright has updated this calculator; sorry about that. To the best of our knowledge at BuildingGreen, spray polyurethane foam (SPF) manufacturers have mostly converted to a very-low-GWP blowing agent, so the embodied CO2-equivalent for that product should now be down around the level of polyisocyanurate (polyiso) insulation. That's great news! The extruded polystyrene (XPS) industry, on the other hand, as far as we have been able to determine, has not yet eliminated the high-GWP blowing agent, HFC-134a. I hope this is useful.
On a site like this, it's astounding that there are comments, like those from Dan and Gavin, that question the reality of anthropogenic global warming, which is settled science except for those few who are still trying to spread doubt in order to support our fossil-fuel industries and our own addiction to cheap energy.
This is a crucially important tool for understanding that more is not always better and that some "solutions" exacerbate the problems. When will we institutionalize the Precautionary Principle as the European Union has done?
Dan gets it. We haven't yet sorted out the reality of whether man-made global warming exists or whether the planet is simply going through a climate change phase. Surely what we do with respect to greenhouse gas emissions has an effect, but what is that effect quantitatively? and how does this study have any kind of effect on that quantitative amount?
This is a great tool for green home builders, homeowners and enthusiasts. Not too many people think about the consequences of using different kinds of insulation. Thank you so much for sharing!
All this looks very nice but when you really look at the big picture here the numbers are minuscule even at your highest values of 1.4 kg per sqft (yr) come on. Are you really going to try and say that this is significant? Yes I know you’ll probably say something like a single grain of sand…etc. but we aren’t even talking about a grain of sand, we are talking about probably 1/100th of a grain of sand but that’s not even the point! You are using the argument that “Man-Made Global warming” is a fact and it’s far from settled, that is another discussion all together though. For now in my humblest opinion is the amount of energy saved in comparison to the (how did you say it here of yes) “Climate Impact of Energy Use + Embodied GWP” is NOT really a consideration, but is does make for a good article and let’s face it that’s what your in the business of, writing articles.
The only thing that would improve this tool is an awesomeness meter (permanently pegged on "MOST AWESOME!") above the graph. I look forward to using this to add more light on what were previously wild assumptions on my part. Thank you all.
Great tool! This is a very important issue for people to be aware of, hopefully this will help with the uncertainty & confusion.
Dan, Gavin: I suggest you read the last IPCC report on climate change, available at http://www.ipcc.ch/. There is essentially no doubt that anthropocentric GHG emissions are impacting the climate significantly. I find it surprising to hear that your questioning this, there has been a scientific consensus on this issue for quite a long time now. It turns out the only "scientists" denying it were funded by oil companies and their papers have not been accepted in any peer reviewed journals.

Add new comment
To post a comment, you need to register for a BuildingGreen Basic membership (free) or login to your existing profile.