Paint the Room Green

Feature

Paint the Room Green

What’s in a Paint?

Psychologists have long known that the colors with which we surround ourselves can affect our energy and our moods. Unfortunately, too few professionals of any type realize how the medium we use to create those colors can affect our health and the health of the planet. This article looks at new developments with interior paints and explores the benefits of these developments for indoor environmental quality, resource use, and pollution prevention.

As might be expected in our ever-growing economy, the scale of the paints and coatings industry is huge.
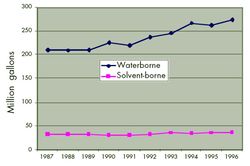
Roughly 1.2 billion gallons (4.5 billion l) of coatings were sold in the U.S. in 1996, with a value of $16 billion, according a report from the National Paint and Coatings Association (NPCA). Just over 50% of this market (by volume) is categorized as “architectural coatings,” which include paints, stains, clear sealers—anything applied to buildings or building components in the field, as opposed to factory-applied finishes. About 57% of the architectural coatings, or 365 million gallons (1.4 million l), were sold for interior use. While there are still many small paint manufacturers, the industry has been consolidating rapidly in recent years, so that the six largest makers now account for nearly 80% of the sales. These manufacturers, along with a handful of specialty, environmentally driven companies, are responding to rapid changes in regulations and market demand with an evolving array of products.

What’s in a Paint?

In the most general terms, paint consists of a pigment, which gives it hiding power and color; a binder, which creates the film that holds the pigment on the substrate; and a carrier, which keeps the binder and pigment in liquid form so it can be applied to a surface.

Oil-based paints traditionally use a drying oil, such as linseed, soy, or tung oil, as the binder. In modern paints these oils are modified into a synthetic polymer known as an alkyd. The alkyd resin is dissolved in a petroleum-based solvent, such as mineral spirits. Recent environmental regulations and health concerns have driven the industry toward high-solids alkyd binders that require less solvent, toward less-toxic solvents, and generally away from oil-based paints.

Driven primarily by regulations aimed at reducing smog, the architectural coatings industry has been gradually switching over to latex, or waterborne, paints. Latex paints have the same basic components as oil-based paints—pigment, binder, carrier—but their formulations tend to be more complicated because additional ingredients are needed to keep the solids in suspension (they are not dissolved in the carrier, as the binders are in solvent-borne paints), to keep the paint from foaming, and to achieve various other functions. Until recently, all latex paints have included some solvents—primarily as coalescing agents, which keep the binder soft and available to form a film as the solvent evaporates.

Latex paints also require in-can preservatives to protect them from spoiling. “Latex resins are like agar for bacteria; they just love it,” says Steve Sides, Director of Environmental Health and International Affairs Division at the National Paint and Coatings Association. In oil-based paints, the solvent serves as the preservative. Fungicides are also added to most exterior paints and some interior paints to reduce mildew growth on the cured paint in humid conditions, although mildew growth after application is more of a problem with oil-based paints than with latex. Preservatives and fungicides, collectively referred to as “biocides,” may include arsenic disulfide, phenol, copper, formaldehyde, quarternary ammonium compounds, and many others, according to the American Institute of Architect’s Environmental Resource Guide. “While biocide manufacturers claim that the formaldehyde in these products won’t come out, EPA data shows that this is not the case,” reports John Chang, a researcher with the EPA’s Indoor Air Division.

Although “latex” once referred only to a natural extract from certain plants, it is now used to describe any of a broad range of mostly synthetic resins that remain flexible over time. The binders used in latex paints are typically polyvinyl acetate (commonly known as white glue), acrylic resins, or a combination of the two. Pure acrylic paints are generally of higher quality and more expensive than vinyl-acrylics. (While the term “vinyl” is often used as shorthand for polyvinyl chloride, or PVC, in this case it refers only to polyvinyl acetate; PVC is used in some specialty industrial coatings, but rarely in architectural coatings.) Paint quality is also determined by the ratio of binders and pigments (solids) to the overall paint. Solids content can range from 25% to 45% by volume. This figure may appear on the technical data sheets for paints. If it doesn’t, solids content can be determined by comparing the wet film thickness to the dry film thickness. For example, dividing a wet film thickness of 4 mils (0.10 mm) into a dry film thickness of 1.5 mils (0.04 mm) yields 0.375, or 38% solids.

The primary pigment used in nearly all paints is titanium dioxide, which is derived from sands rich in titanium-containing minerals. Titanium dioxide provides the hiding power to cover whatever is under the paint surface, and a bright white color. Roughly one-quarter (by weight) of a typical can of paint consists of this mineral. Chalk, talc, and certain clays are also used as white pigments, though these are less effective than titanium dioxide.

The other primary inorganic (mineral) pigments used are iron oxides, which can be refined from iron ores or synthesized from other minerals. Most iron oxide pigments are made from ferrous sulfate, which is created during the processing of titanium dioxide, or from sodium hydroxide, which is a by-product of chlorine production from salt brine. The other large (and growing) class of pigments are organic pigments synthesized from petrochemicals. These tend to be more expensive than inorganics and they are more susceptible to fading over time, but they offer brighter colors and a wider range of color choices.

Volatile Organic Compounds

With oil-based paints, the entire carrier is a volatile organic compound (VOC), creating odors and contributing to smog generation as it evaporates.
Most latex paints contain some solvents, primarily coalescing agents, but since the carrier is water, the overall VOC levels are much lower, ranging from 0 to 200 grams per liter, compared with 250 to 750 g/l for traditional oil-based paints. VOCs are often referenced as the sole indicator for how “healthy” a paint is. At first glance this approach would seem to make sense, because chemicals that offgas (volatilize) are most likely to be inhaled and affect our health. A closer look, however, reveals that it’s dangerous to rely too heavily on this one indicator.

There are two reasons to avoid (or minimize) VOCs in paints: ambient air quality and indoor air quality. From a regional and global environmental perspective, VOCs react in sunlight with other pollutants, such as nitrous oxides from combustion of fossil fuels, to create ozone and smog. Unlike ozone in the stratosphere, which protects us from overexposure to ultraviolet radiation, ground-level ozone is a pollutant that causes respiratory problems, damages plants, and contributes to global warming.

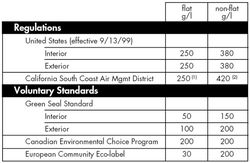
The need to reduce ground-level ozone is the primary motivation behind regional, state, and now national regulations that limit the amounts of VOCs in coatings (see Table 1). In preparation for establishing a national standard, EPA determined that architectural coatings account for “about 9 percent of the [VOC] emissions from all consumer and commercial products,” according to the U.S. Federal Register of September 11, 1998. The new standard affects coatings manufactured after September 13, 1999, except for coatings registered as pesticides, which have until March 10, 2000 to comply. Long before this national regulation appeared, some regions of the country with serious smog problems have been driving the industry toward lower VOC levels. For example, the new national limit of 250 g/l in flat paints has long been the law in southern California, and the limit there is scheduled to drop to 100 g/l in 2001 and to 50 g/l in 2008.

Advocates of indoor environmental quality buildings are also concerned about VOCs, but since there is little direct sunlight in buildings, ozone is not the main issue. More problematic are the potential health affects of the VOCs themselves and of various compounds that are created as these VOCs react with other chemicals in the coating and in the air.

Technically, a VOC is any organic (carbon-based) compound that evaporates at typical ambient temperatures. The European Commission defines VOCs as organic compounds with a boiling at or below 250°C (482°F). Some other definitions, such as that of the World Health Organization, exclude highly volatile compounds such as formaldehyde because they are already fully converted to gas form at ambient temperature and pressure.

The US EPA defines VOCs in an entirely different way. Since the regulation is concerned only with smog reduction, the EPA definition includes nearly any carbon-based compound regardless of boiling point, but then exempts compounds that do not react in sunlight (photochemically) to produce smog. The list of exempt chemicals is under continuous review and is updated periodically. These exempt chemicals may be included in paints and other products without contributing to the EPA-defined VOC content. While they may not contribute to smog, these chemicals are not necessarily safe to breathe, so from an indoor environment perspective they may still be of concern. Exempt VOCs that might be found in paints include acetone and methyl acetate.

There are other problems with relying on total VOC levels in a product as a toxicity indicator. VOCs come from a range of natural and synthetic sources, and those from either source can vary widely in their health effects. Many solvents traditionally used in paints are now being phased out due to their toxicity and potential carcinogenicity. The EPA maintains a list of hazardous air pollutants (HAPs) with stringent reporting requirements, and voluntary standards organizations like Green Seal have a list of chemicals that are not allowed in their eco-labeled paints.

To further complicate matters, VOCs in the air are never just one isolated compound, and even when information is available about the individual chemicals, their effect in combination can be quite different. In addition, VOCs can react with other chemicals to create new compounds not found in the original product. Recent research by John Chang of the EPA shows that irritating aldehydes are created during the curing of some alkyd (oil-based) paints—these aldehydes don’t appear in the uncured paint and don’t show up in the emissions data until about an hour after application. Previous research had shown examples of chemicals that react in the air with ozone and other compounds to form new chemicals, which may or may not be more problematic than the original compounds (see EBN

Vol. 5, No. 3, page 16).

Zero-VOC Paints

Paint chemistry is constantly evolving, and one recent breakthrough has been the emergence of latex paints made with no organic solvents.
Early generations of solvent-free latex paints suffered from various weaknesses. The first to be widely available, Glidden’s Spred 2000 (see EBN Vol. 3, No. 1, page 7) didn’t hold up well to scrubbing. But as the technologies have continued to evolve, so has the performance of these paints. Spred 2000 has been replaced in the Glidden (now part of ICI) lineup by the more durable Promaster paints, and at least a dozen other companies now offer solvent-free paints as “low-odor,” “zero-VOC,” or “very low-VOC” (see Table 2 on pages 14–15).

It is virtually impossible for a paint to eliminate VOC emissions entirely, as nearly every organic chemical is released in trace amounts as a gas. But the standard testing protocol for VOCs, known as EPA Reference Test Method 24, is not accurate at low levels, so any paint with VOCs in the range of 5 g/l or less can be called “zero-VOC.” Only one paint, ICI’s Lifemaster 2000, is independently certified as VOC-free by Scientific Certification Systems, Inc. of Oakland. SCS has the paint tested twice a year using a more sophisticated mass spectrometry method. ICI’s Robin Pirie contends that other paints are not as low in VOCs as theirs: “Other paints might not be zero-VOC if they were tested under this method.”

Most of these paints still use colorants with some solvent, so tinting the paint will introduce a small amount of solvent (proportional to the amount of color added). Since heavy tinting of these paints would introduce substantial amounts of VOCs, most of these are only available in light colors. The Lifemaster 2000 line is an exception, as is the Enviro-Safe line from Chem-Safe Products. These products and a few others use a somewhat more expensive solvent-free colorant system.

The large paint companies, including ICI, Benjamin Moore, and Sherwin-Williams, market their low-odor paints primarily to healthcare facilities and to building managers for use in occupied buildings. There are often substantial savings to be had in not needing to vacate a space when it’s being painted, and in allowing painters to work during normal business hours rather than paying extra for after-hours labor.

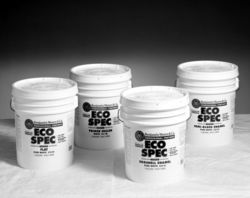
Benjamin Moore had originally introduced its Pristine zero-VOC line as a consumer product (see EBN Vol. 4, No. 1) but is now redirecting its marketing efforts at professionals and renaming the paint “Pristine Eco-Spec.”
“It was disappointing that consumers did not embrace Pristine initially,” says marketing director Eileen McComb. McComb feels that consumers are confused about the benefits of zero-VOC paints, since all latex paints are pitched as “low-VOC.” She’s optimistic about the professional market, however. “We were getting five or six calls a week. Many people are asking for clean-air formula product,” she notes. McComb attributes this interest among professionals to educational efforts from organizations such as the National Association of Home Builders, the U.S. Green Building Council, and the American Institute of Architects. Pristine Eco-Spec should be on dealer shelves in March of 1999.

“Zero-VOC” does not always mean “nontoxic” however, as some of the other chemicals used in these paints may be just as hazardous as those in standard paints. With the exception of a couple of products sold directly to users as low-biocide, all these paints contain toxic preservatives to give them the shelf-life they require in a typical distribution system. David Kibbey, a Berkeley, California consultant who works with chemically sensitive clients, reports that some of his clients are sensitive to certain zero-VOC paints, and other clients to different formulas.

Low-Toxic Paints

A number of specialty paint manufacturers market products that claim to be less toxic than standard paints. Some of these are petrochemical- based, but the chemicals are chosen for low-toxicity. Others—imported from Europe—are based primarily on binders and solvents that are derived from plants rather than from petrochemicals. And a few, such as milk paint, avoid most of the toxicity problems altogether, but they also don’t form a protective film the way standard paints do.

Low-toxic paints made from petrochemicals tend to be relatively low in VOCs, though not necessarily solvent-free. San Diego-based American Formulating & Manufacturing (AFM) produces both zero-VOC and standard “low-VOC” water-based paints in its Safe Coat paint lines. Aside from low-VOC levels, AFM’s claims of low-toxicity are based on the use of safer ingredients. These include coalescing agents such as propylene glycol, instead of the more hazardous (and less expensive) ethylene glycol, and high-quality binder resins that cure into a tight matrix, making them less likely to release trace amount of hazardous chemicals.

Samuel Goldberg, president of AFM, claims that with their high-quality ingredients the paint performs as well as conventional paints, but he also acknowledges that there are compromises. “Our paint doesn’t do the painter’s job for them,” Goldberg notes, referring to the fact that standard formulations, with solvents, can make up for a lot of sloppy work. For example, AFM avoids phenol-based biocides, so the paints are less effective at preventing mildew spread, especially if surfaces are already contaminated. Proper surface preparation, always a good practice for a durable finish, is essential with these alternative products.

Anecdotal evidence on the performance of these products suggests that their performance has improved with recent reformulations, and they now perform similarly to conventional paint. Cost remains an issue, however, as they frequently run upwards of $30 per gallon. And none of these companies have distributors throughout the country (see table on pages 14-15); in an area with no local dealer, shipping costs and delays can also be obstacles.

Natural paints, represented in the U.S. by German imports Livos, Auro, and Bioshield, try to avoid petrochemicals entirely, making paints only from plant-based resins, solvents, and pigments. Auro paints claim to adhere to this rule strictly. Ingredients in Auro paints include dammer resin, carnauba wax, shellac, and natural latex. Calcium carbonate (chalk) is used as the primary hiding pigment. Livos and Bioshield use many of the same ingredients, though some Livos products contain isoaliphatic hydrocarbons, which are fossil-fuel solvents that have been purified to eliminate their more noxious properties.

These companies, along with the Old Fashioned Milk Paint Company in Massachusetts, also produce paints based on milk protein, or casein as the binder.

The Wisconsin Department of Agriculture has even researched the production of milk paint as a possible use for the roughly 20 million pounds (9.1 million kg) of milk that is dumped annually due to excessive antibiotic levels. (The antibiotics would first be removed using enzymes.) In addition to the casein binder, milk paint contains standard chalk and/or titanium dioxide pigments and lime. Some companies distribute milk paint in powder form, which avoids the need for in-can preservatives. Regardless of how it is distributed, milk paint must be protected from moisture both before and after application, or it can sour or mildew, and walls covered with sour paint are no small problem! A clear sealer is sometimes recommended to protect the milk-painted surfaces, but this negates most of the benefits of using this nontoxic finish.

Although it has only been a few generations since plant-based paints (typically with white lead—lead carbonate—as the pigment) were the only option, contractors and homeowners have now grown accustomed to the ease and convenience of petrochemical-based products. By comparison, most of the natural paints are quite sensitive to work with, demanding skill and experience. The results tend to be more of a handmade look than the industrial uniformity offered by conventional paints.

Other than milk paint, the fact that these paints are made from natural ingredients does not necessarily mean that they are nontoxic. For example, many natural paints rely on the citrus-peel extract d-Limonene as their solvent. This solvent has a strong, persistent smell, which some chemically sensitive people find problematic. “We painted our house with Livos paints, and my wife couldn’t move in for three months due to the strong citrus odor,” reports healthy house consultant John Bower. “Sensitive people tend to do better with the low-odor synthetic paints than with natural paints,” he told EBN. Toxicological data on d-Limonene confirms that it is a known irritant and sensitizer, even though it is “generally recognized as safe” for use in foods by the U.S. Food and Drug Administration.

Also, d-Limonene is one of the VOCs that is known to react with ozone in the air to form, among other things, formaldehyde.

Resources and Pollution from Manufacturing

There are so many different constituents in paints that assessing the life-cycle impacts of even a single paint formulation is a huge job. In general, petrochemical solvents are responsible for pollution problems from the wellhead to the end-use, and reducing their use is desirable. From that perspective alone, water-based paints are environmentally preferable. The environmental impact is further reduced by the fact that latex paints do not require solvents for cleanup. Due to the hazards involved, oil-based paints are rarely recycled into new paint. When they are collected for “recycling,” it is usually for use as fuel in cement kilns. Safety-Kleen, Inc. is the only company EBN found that is making new oil-based paint from old.

When it comes to binders, however, the situation is more complex because the alkyd binders used in oil-based paints are at least partially derived from plant-based resins, while the vinyl acetate and acrylic resins in water-based paints are produced via a series of highly toxic intermediaries in the petrochemical process.

Work is under way on a new generation of water-dispersible alkyds that perform like the high-quality binders in oil-based paints but are carried in water. Some of these are made using soy-based resins, which could help restore the market for plant-based polymers in the coatings industry. There is also a soy-based latex paint in the works that, according to the United Soybean Board, will be on the market later this year.

The production of pigments can be a highly polluting process. When titanium dioxide is extracted from sand, large quantities of by-products are produced that have historically been disposed of by ocean dumping and/or deep-well injection. The process of refining titanium dioxide is also very energy intensive, with significant releases of carbon dioxide and sulfur oxides. The European Community considers these problems associated with titanium dioxide so serious that they have established limits on the amount of white pigment allowed, and limits on allowable emissions from pigment manufacture, for paints under consideration for the European Eco Label.

Recycled Paint

A clear winner in terms of reduced upstream impacts is recycled paint, because the main raw material is leftover paint from other users. Recycled paint has a poor reputation, but there are, in fact, different degrees of recycling and qualities of paint, so some recycled paints might be appropriate for certain jobs. For the right application it makes sense to use recycled paint, not only to reduce environmental impacts, but also because it’s usually a bargain, with prices ranging from $0 to $10 per gallon.

The paint that is available free is the most risky and should be used only where a top-quality finish isn’t the goal. It is often made by local waste management agencies, which simply collect leftover paint, sort it by type and depth of color, and filter out the larger impurities. Giving this remixed paint away free is still a good deal for the agency, because otherwise they would have to pay to dispose of it. The biggest drawback with nearly all recycled paint is the limited color selection: typically off-white, beige, and brown.

True paint recycling involves getting the leftover paint to a paint manufacturer or specialized recycler, where it can be tested for various properties and so that virgin materials can be added, as needed, to create paint of the desired quality. This is the approach taken by the Atlantic County Utilities Authority, working with Focus Recycling in Warren, New Jersey, and by Paint Solutions, Inc., with operations in St. Louis, Missouri and Kent, Washington (with arrangements through Phillips Environmental for paint collection in ten western states). These recyclers sell primarily to state agencies and other large buyers, and they can custom-tint batches to meet specific orders.

The most sophisticated recycling is done by Kelly-Moore Paint Company at their Sacramento, California facility. Kelly-Moore has been selling recycled paint since 1992. Ray Julian of the company says that they remanufacture the paint to perform like their mid-grade virgin paint: “It’s a medium grade exterior paint,” he says, adding: “Our recycled paint is at least as good as most companies’ exterior acrylic latex.” Kelly-Moore’s E-Coat is the only recycled paint that is consistently available in smaller quantities. While it is not stocked at all Kelly-Moore stores, it can be ordered through them without any shipping charge.

Remanufactured paints (as opposed to locally remixed paints) are frequently tested for hazardous constituents and VOCs, and they are well within acceptable legal guidelines. Julian reports that the VOC levels in his paints typically run between 100 and 150 g/l, which is average for waterborne paints. Recycled paint lines don’t distinguish between interior and exterior use, and they are likely to contain small quantities of mildewcides from the collected exterior paints. Where indoor air quality is a paramount concern, recycled paints are not the best choice.

Dealing With Leftover Paint

Unfortunately, all too often leftover paint is dumped illegally into sewers or into the ground. The Province of British Columbia is far more aggressive about dealing with used paint than any other location in North America, requiring paint manufacturers to take back all leftover paint for recycling. To cover the cost of this mandate, all paint purchased in B.C. is assessed an “eco-fee” of Canadian $0.50 per gallon or $1 per five-gallon container. These fees are used by the B.C. Paint Care Association (established by the paint manufacturers) to support a network of over 100 collection sites in the Province, to which paint users can take their leftover paint. According to Paul Iverson, director of the Association, the eco-fees are the best educational tool for consumers, because they always want to know why they’re being assessed the fee. Their surveys indicate that before the program began in 1994, “42% of consumers knew not to put stuff down the drain or in the garbage,” says Iverson. “At the end of 1997, 87% of people knew.”

In the U.S., the NPCA purports to distribute information about paint recycling, but in effect the NPCA discourages the practice, either out of concern that it will make paint handling seem more cumbersome, or because its members might lose sales to recycled paint. With latex paint, the Association’s Web site actually recommends letting the paint dry and then discarding it with the trash, although it notes that this practice might not be legal in California, Minnesota, or Washington.

Conclusions

The good news is that regulatory constraints are actively removing the most polluting, oil-based paints from the market, while other bad actors, including lead and mercury, have already been eliminated. The bad news is that titanium dioxide pigment, used in nearly all paints, represents an often-overlooked environmental problem, and all conventional paints are products of a polluting and toxic petrochemical industry. Colors are a wonderful addition to our interior spaces, and they can contribute to the quality and mood of the space. Like most products, the best environmental solution is to use only what’s necessary and handle it with care.

Checklist: Checklist for Paints 

The checklist on page 18 offers suggestions for reducing the downside of interior paints.

— Nadav Malin


For more information:
 

National Paint and Coatings Association
1500 Rhode Island Avenue NW
Washington, DC 20005-5597
202/462-6272, 202/462-8549 (fax)
www.paint.org

Dana Duxbury, Paint Recycling Specialist
Waste Watch Center
16 Haverhill Street
Andover, MA 01810
508/470-3044, 508/470-3384 (fax)
www.wastewatch.org
Deborah Stowitts, Communications Dept.
Southwest Research Institute
P.O. Drawer 28510
San Antonio, TX 78228-0510
210/522-2046, 210/522-3547 (fax)

Green Seal
1400 16th Street NW, Suite 300
Washington, DC 20036
202/588-8400, 202/588-8465 (fax)
www.greenseal.org

Published February 1, 1999

(1999, February 1). Paint the Room Green. Retrieved from https://www.buildinggreen.com/departments/feature
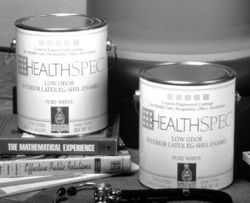
Small is Beautiful: House Size, Resource Use, and the Environment

Low-Slope Roofing: Prospects Looking Up

Linoleum: The All-Natural Flooring Alternative

Light Pollution: Efforts to Bring Back the Night Sky

Radon and Other Soil Gases: Dealing with the Hazards from Below

Feature

Radon and Other Soil Gases: Dealing with the Hazards from Below

Though radon is the most serious threat overall, there are many other soil gases that builders of environmentally responsible buildings should be aware of.

Published July 1, 1998

Energy Star Programs: Uncle Sam's Partnerships for Energy Efficiency

Structural Insulated Panels: An Efficient Way to Build

Feature

Structural Insulated Panels: An Efficient Way to Build

Structural Insulated Panels (SIP), have been around since the 1950s but only began making inroads into the construction industry in the 1980s.

Published May 1, 1998

Thermal Mass and R-value: Making Sense of a Confusing Issue

Feature

Thermal Mass and R-value: Making Sense of a Confusing Issue

Background on the physics of heat transfer to help understand the relationship between thermal storage and heat flow, and when this information is relevant and how it should be used in building design. 

The advertisement promises R-30 from a lightweight masonry block wall system. Log home product literature claims that log walls insulate as well as fiberglass because of the thermal mass. Salesmen at a trade show argue that a new fiber-cement building system achieves R-28 even though the “tested” R-value comes in at only R-16.

What’s going on here? Do these claims of “effective R-values” that greatly exceed the widely published R-values for high-mass materials hold up? Just what effect does thermal mass have on the energy performance of an exterior wall system? The issue of thermal mass and its effect on the energy performance of buildings is one of the most confusing issues facing designers, builders, and buyers of buildings today. This article tries to sort out these mysteries, providing enough background on the physics of heat transfer to understand the relationship between thermal storage and heat flow, and then explaining when this information is relevant and how it should be used in building design. This article does not address the use of thermal mass inside a building, where it can store heat (or coolth) and even out temperature fluctuations.

Understanding Heat Transfer

Heat flows by three mechanisms: conduction, convection, and radiation.

  • Conduction is the molecule-to-molecule transfer of kinetic energy (one molecule becomes energized and, in turn, energizes adjacent molecules). A cast-iron skillet handle heats up because of conduction through the metal.
  • Convection is the transfer of heat by physically moving the molecules from one place to another. Hot air rises; heated water thermosiphons; our forced-air heating systems work by moving hot air from one place to another.
  • Radiation is the transfer of heat through space via electromagnetic waves (radiant energy). A campfire can warm you even if there is wind between you and the fire, because radiation is not affected by air.

With buildings, we refer to heat flow in a number of different ways. The most common reference is “R-value,” or resistance to heat flow. The higher the R-value of a material, the better it is at resisting heat loss (or heat gain). U-factor (or “U-value,” as it is often called) is a measure of the flow of heat—thermal transmittance—through a material, given a difference in temperature on either side. In the inch-pound (I-P) system, the U-factor is the number of Btus (British Thermal Units) of energy passing through a square foot of the material in an hour for every degree Fahrenheit difference in temperature across the material (Btu/ft2hr°F). In metric, it’s usually given in watts per square meter per degree Celsius (w/m2°C)

R-values are measured by testing laboratories, usually in something called a guarded hot box. Heat flow through the layer of material can be calculated by keeping one side of the material at a constant temperature, say 90°F (32°C), and measuring how much supplemental energy is required to keep the other side of the material at a different constant temperature, say 50°F (10°C)—all this is defined in great detail in ASTM (American Society of Testing and Materials) procedures. The result is a steady-state R-value (“steady-state” because the difference in temperature across the material is kept steady). R-value and U-factor are the inverse of one another: U = 1/R. Materials that are very good at resisting the flow of heat (high R-value, low U-factor) can serve as insulation materials. So far, so good.

Materials have another property that can affect their energy performance in certain situations: heat capacity. Heat capacity is a measure of how much heat a material can hold. The property is most significant with heavy, high-thermal-mass materials. As typically used in energy performance computer modeling, heat capacity is determined per unit area of wall. For each layer in a wall system, the heat capacity is found by multiplying the density of that material, by its thickness, by its specific heat (specific heat is the amount of heat a material can hold per unit of mass). Water has a specific heat of 1 Btu/lb.°F (1.9 kJ/kg°C), while most building materials are around 0.2 to 0.3 Btu/lb.°F (0.4 to 0.6 kJ/kg°C).

If there are various layers in the wall, total heat capacity is found by adding up the heat capacities for each layer (drywall, masonry block, and stucco, for example). In the following section, we will examine how the heat capacity of materials can affect the energy performance of buildings.

“Mass-Enhanced R-Value”

When people refer to the “mass effect” or “effective R-value,” they are generally referring to the ability of high-mass materials, when used in certain ways, to achieve better energy performance than would be expected if only the commonly accepted (steady-state) R-value or U-factor of that material were considered. Let’s take a look at a typical use of one of these high-mass materials in a wall system. When one side of the wall is warmer than the other side, heat will conduct from the warm side into the material and gradually move through it to the colder side. If both sides are at constant temperatures—say the inside surface at 75°F (24°C) and the outside surface at 32°F (0°C)—conductivity will carry heat out of the building at an easily predicted rate. As described above, this steady-state heat flow is what most test procedures for determining R-value measure.

In real-life situations, however, the inside and outside temperatures are not constant. In fact, in many parts of the country, the driving force for conductive heat flow (remember, heat always moves from warmer to colder) can change dramatically or even reverse during the course of a day. On a summer afternoon in Albuquerque, New Mexico, for example, it might be 90°F (32°C) outside, and the outside wall surface—because it has a dark stucco—might be even hotter. It’s cooler inside, so heat conducts from the outside surface of the wall inward. As night falls, however, it cools down outside. The air temperature may drop to 50°F (10°C). The driving force for heat flow changes. As the temperature difference across the wall is reversed, the heat flow is also reversed—drawing heat back towards the outside of the building. As a result of this modulating heat flow through a high-heat-capacity material, less heat from outside the building makes its way inside. Under these conditions, the wall has an effective thermal performance that is higher than the steady-state R-value listed in books (such as ASHRAE’s Handbook of Fundamentals). This dynamic process is what some people call the “mass effect.”

Another common scenario is when the outside temperature fluctuates but never crosses the indoor setpoint temperature. In this case, the direction of heat flow never changes, but the thermal lag or time delay in heat flow can still be beneficial by delaying the peak heating or cooling load. For example, if the outdoor temperature in Miami peaks at 95°F (35°C) at 5:00 on a summer afternoon, but it takes eight hours for the heat to travel through the wall, the effect of that peak temperature won’t be felt inside the building until the middle of the night. Because most cooling equipment operates at higher efficiency if the outdoor air temperature is lower and because nighttime thermostat settings may be higher (at least in commercial buildings), potentially significant savings can result. Not only can total cooling energy be reduced, but peak loads can also be reduced. This can lead to smaller (and less costly) mechanical systems and lower demand charges for electricity. This time lag effect can save energy and money, but note that it does not affect the total amount of heat flowing through the wall.

As noted above, the amount of heat flow through a wall is reduced by the use of thermal mass when the temperatures fluctuate above and below the desired indoor temperature, so under these conditions a material might have a “mass-enhanced” R-value that is greater than its steady-state R-value. To estimate this mass-enhanced R-value for a given high-mass material in a particular climate, researchers at Oak Ridge National Laboratory measure the thermal performance of a high-mass wall under  dynamic conditions, in which the temperature on one side of the wall is kept constant and the temperature on the other side is made to fluctuate up or down. With this measured heat flow under dynamic conditions as a basis, they then use computer modeling to arrive at steady-state wall R-values that would be required to achieve comparable overall energy performance under various climate conditions. Those results are what we are calling the “mass-enhanced R-values” for the high-mass material under the modeled conditions. (Others refer to this as the effective R-value, a term that can be misleading.) The multiplier obtained by dividing the mass-enhanced R-value of a material in a given climate by its steady-state R-value is referred to by Oak Ridge researchers as the Dynamic Benefit for Massive Systems (DBMS).

When is Mass-Enhanced R-Value Significant?

The mass effect is real. High-mass walls really can significantly outperform low-mass walls of comparable steady-state R-value—i.e., they can achieve a higher “mass-enhanced R-value.” BUT (and this is an important “but”), this mass-enhanced R-value is only significant when the outdoor temperatures cycle above and below indoor temperatures within a 24-hour period. Thus, high-mass walls are most beneficial in moderate climates that have high diurnal (daily) temperature swings around the desired indoor setpoint.

Nearly all areas with significant cooling loads can benefit from thermal mass in exterior walls. The sunny Southwest, particularly high-elevation areas of Arizona, New Mexico and Colorado, benefit the most from the mass effect for heating. In northern climates, when the temperature during a 24-hour period in winter is always well below the indoor temperature, the mass effect offers almost no benefit, and the mass-enhanced R-value is nearly identical to the steady-state R-value. The ASHRAE Handbook of Fundamentals lists “mean daily temperature range” data for hundreds of U.S. climates in the chapter on climate data. These values can be helpful in figuring out how significant mass-enhanced R-value might be for a particular climate, but they do not tell the whole story; also significant is the percentage of days during the heating and cooling seasons when the outdoor temperature cycles above and below the indoor temperature.

Do We Need Mass-Enhanced R-Value Ratings?

Clearly, high-mass materials used in exterior walls perform better than would be expected based solely on their steady-state R-values. But the actual thermal performance is highly dependent on where the building is located. Manufacturers of these materials rightly want to take credit for this improved performance, but how can that be done in a way that doesn’t exaggerate performance for parts of the country where the mass effect benefit just isn’t there? “Right now, we don’t have a system that forces people to deal with calculations in a constant way,” says Bruce Wilcox, P.E., of the Berkeley Solar Group, who has done extensive modeling of mass effects for the Portland Cement Association and others.

All sorts of claims are being made about mass-enhanced R-value (usually called “effective R-value”) with little standardization. The first step needs to be consensus on how the mass effect should be accounted for in testing and modeling. Jeffrey Christian at Oak Ridge National Laboratory has been developing and refining the method of dynamic thermal analysis and simulation described above. This is the most extensive effort to date to quantify the mass effect. Christian’s group, with the help of Bruce Wilcox and others, also developed thermal mass tables for the Model Energy Code in the late 1980s that can be used to account for the thermal mass benefits of high-mass building materials in wall systems.

The next step, suggests Christian, might be to formalize the testing and simulation procedures through development of ASTM standards. Establishment of an ASHRAE committee to address the mass effect may also be in the works. To ensure that such standards would be applied in a consistent manner, Wilcox suggests that applicable industries might have to set up some sort of council, perhaps modeled after the National Fenestration Rating Council (NFRC), which enforces consistent reporting of window energy performance. Such a “Thermal Mass Rating Council” might oversee standards relating to how mass effect and mass-enhanced R-value are reported. Wilcox remains leery of the whole concept of mass-enhanced R-value—not that the effect exists, but whether it can be used clearly with building materials. “I don’t know if there’s any way to make it a property of the material,” he told  EBN, “It’s a property of the system.” There are a lot of questions to sort out, such as how many climates need to be modeled: are six enough, as Oak Ridge researchers have used, or do we need 20? Would such a system take credit for time delays in heat transfer, or just actual reductions in the amount of heat that moves through? Who will pay for all the research to make this happen? Are the industries that sell high-mass materials large enough to support a Thermal Mass Rating Council and the additional research needed on these issues?

Final Thoughts

High-mass building materials can offer significant energy benefits in exterior walls. The benefit may be primarily in the shifting of peak load conditions or in an actual reduction in overall heat gain or loss. These benefits are highly dependent upon where the building is located, how it is designed, and how it is operated. How we should give credit—in terms of energy performance—for high-mass building materials is still very much open for debate. Until standardized procedures for determining the regional significance of the mass effect are widely applied, there will likely be continued confusion and continued exaggeration regarding the energy benefits of thermal mass. Oak Ridge researchers and companies such as Agriboard Industries are helping to bring these issues into public awareness, but a great deal of work remains to be done.

For more information:

Jeffrey Christian
Oak Ridge National Laboratory
Bldg 3147, P.O. Box 2008
Oak Ridge, TN 37831-6070
423/574-5207, 423-574-9338 (fax)

Barry Sullivan
Agriboard Industries, L.C.
P.O. Box 645
Fairfield, IA 52556
515/472-0363, 515/472-0018 (fax)

Portland Cement Association
5420 Old Orchard Road
Skokie, IL 60077
847/966-6200

Bruce Wilcox, P.E.
Berkeley Solar Group
58 Calvert Court
Piedmont, CA 94611
510/601-7475, 510/601-7415 (fax)


Published April 1, 1998

Getting to Know a Place: Site Evaluation as a Starting Point for Green Design

Feature

Getting to Know a Place: Site Evaluation as a Starting Point for Green Design

The National Wildflower Research Center outside of Austin, Texas blends beautifully with the land on which it sits—a cluster of buildings connected by rich landscapes of native plants; rainwater harvesting to minimize depletion of the threatened Edwards Aquifer; walking paths through meadow, prairie, and woodland ecosystems; and carefully designed parking areas to filter and purify stormwater before it seeps into the ground. A thousand miles northeast and like many subdivisions outside Chicago, Prairie Crossing is being built on productive farmland. But unlike most, the homes here are clustered on just a small portion of the land, the rest being used in active agriculture or restored to the native tall-grass prairie that once existed here. And on the rugged Big Sur coast, Post Ranch Inn—the first commercial development in decades in what is one of the nation’s most anti-development areas—blends seemlessly into the environment, its modules of lodging rooms half-buried and barely visible to either hiker or the extreme winds that pound the hillside.

What these places share is a connection to the site. Their designs were integrated into the local ecosystem after careful study of what was there and how the natural beauty and health of that ecosystem could be protected, restored, and celebrated. This link between development and the land is all-too-often neglected. Indeed, landscape design is often an afterthought, a plan addressing which shrubs to plant that is developed after the building is completed (budget permitting), with total disregard for what the original building site offered to start with and what its ecosystem calls out for.

This article addresses what should be the first step in most green building projects (certainly those on “greenfield” sites): getting to know a place. This component of the development process should include, whenever possible, a landscape architect or designer. With or without such specialists, however, it is important for all players on a development team to recognize the importance of site evaluation and to understand the site planning and design priorities that emerge from this site evaluation. As landscape architect Walt Cudnohufsky, founder of The Conway School of Landscape Design, points out, we need to “give the environment a voice.” The following pages will introduce this topic, outline key components, and provide simple checklists that can serve as a starting point for ecologically integrated building and landscape design.

Landforms


The underlying physical nature of a site—geology, soils, topography, surface waters, and groundwater—informs the building and landscape design in many important ways, ranging from protection of wetlands to decisions about foundation design and wastewater treatment options.

Much of this information is now digitally available in a standardized GIS (Geographic Information System) format that can be used in many CAD software programs.


Geology


The underlying geology of a site influences topography, depth to bedrock, soil composition and fertility, drainage, subsurface water, and vegetation types. While soils are more direct in their influence on vegetation and land uses, a great deal can be learned from an area’s geology, and it makes a good starting point in site investigations. Examine geological maps produced on state or regional scales by the U.S. Geological Survey (USGS). Consider visiting a nearby college or university offering a geology program; use the library or speak to a professor to learn more about the geology of your region.


Topography

Steep slopes are susceptible to erosion and are best protected from development. Just how steep a slope can be before erosion becomes a significant concern depends on the soils; slopes in excess of 30% are rarely developable, and even 15% will be too steep for some soils. On the other hand, flat parcels of land do not offer as good drainage and they are often better used for agriculture, parking, and recreation. Pockets of low-lying land may be ecologically important (and fragile) wetlands.

Slope is usually described as “percent grade.” This is the ratio of rise over run, given as a percentage; in other words, a 45° slope would have a 100% grade. USGS topographic maps usually do not have high enough resolution to show site-specific topography clearly. Contour maps derived from digital, aerial

orthophotos can offer more detail, but are not available for all locations. It is often advisable to have a more detailed and accurate field survey performed of the property, or at least those portions of the property to be developed.


Soils


Soils are created by the breakdown of bedrock and sediments, by the deposition of organic matter from above, and by the action of living organisms and natural forces (water and wind) in mixing and modifying those components. Properties of soil determine how readily moisture can seep into the ground, whether expansion with moisture will cause foundations to buckle or crack, how significant a concern soil compaction is (risk of construction damage to trees), and what sort of plantings will prosper with what level of care.

Excellent information on soils is usually available from the federally funded Natural Resources Conservation Service (previously the Soil Conservation Service). NRCS publishes highly detailed, county soil maps that are available from state or county NRCS offices or from county agricultural extension offices. On these maps—superimposed on aerial photographs—soils are delineated and classified according to a widely accepted system that relates the physical properties of the soil to its development potential and constraints. Such information as depth to bedrock and depth to the water table can be learned from the maps and explanatory text. An experienced landscape architect, civil engineer, or soils technician can use this information to provide valuable guidance to the site planning process, determining appropriate locations for buildings, septic system drainage fields, stormwater infiltration beds, driveways, etc.


Hydrology

Surface waters, wetlands, and groundwater are critically important. Surface waters and wetlands, including ponds, streams, seasonal (vernal) ponds, and estuaries, tend to be our richest and most diverse ecosystems, and they can easily be damaged by development. Groundwater is a resource that may have only minimal direct impact on a particular site being developed, but its purity is an important issue downslope where it seeps to the surface or is pumped out of the ground as potable water.

All surface waters and wetlands on a site being considered for development should be mapped. Hydrologic maps may be available from USGS, NRCS, or a local planning agency. National Wetlands Inventory mapping is also available, showing significant wetland areas. All of this hydrologic mapping information, however, is quite general; more detailed information should always be collected through on-site investigations. The most difficult of these are detailed wetland inventories, because wetlands may not be as obvious as other surface waters. There are various definitions of wetlands that are used by different agencies. In general, wetlands have one or more of the following characteristics: the presence of water on the surface (usually relatively shallow) for all or part of the year; the presence of distinctive, recognizable soils, usually with high organic content or anearobic conditions; and the presence of vegetation that is adapted to—and indicative of—wet soils, surface water, and/or flooding. Very often, wetlands are subdivided into several classifications. A hydrologic map should show all surface waters as well as wetlands, divided into subtypes when possible. Wetlands delineation is generally required by regulatory bodies.

General information on groundwater can be obtained from geologic, hydrologic, or soils maps, but as with the surface waters and wetlands maps, these will rarely be very precise. Data on drilled wells in the area might also be available from the state or county. Knowing the depth and recharge rate of drilled wells in your area will help you get a sense of what you can expect on your site. If extremely deep wells with very low recharge rates are the norm, for example, that might suggest that such strategies as xeriscaping and rainwater catchment should be considered.


Vegetation


Vegetation is both a highly visible component of most landscapes and an excellent indicator of soils, wetlands, and trends that are affecting the land, such as air pollution, impaired drainage, soil disturbance, or runoff of road salt along highways. Through careful analysis of vegetation on a site, it is often possible to determine what the past level of disturbance has been and what the native vegetation might have been like prior to European settlement, though the latter may be difficult to discern based solely on analysis of what’s there today.

This information can be used to plan a strategy for protecting or restoring native ecosystems that will support healthy and productive biodiversity on the site. It can also be used to figure out where buildings and roadways would be most appropriate. Building placement may make the most sense on ecologically damaged areas of a site, for example, or where natural shading will help reduce cooling loads. Vegetation can also have a significant impact on views, wind blockage, the microclimate, sound control (here the effect is less than a lot of people assume), and even property values—a single large shade tree left on a building lot can enhance the value of a new home by thousands of dollars (see

EBN

Vol. 4, No. 1, p. 4).

Any detailed evaluation of a site should include a careful inventory of vegetation. Vegetation can be classified in a number or ways, including floristic (classification by species), and physiognomic (classification by form and function—forest, woodland, grassland, etc.). Often, the vegetation analysis will categorize the vegetation types into different levels, each based on a different classification type. A very detailed vegetation inventory might also include mapping of individual trees. At the 1600- acre (647 ha) Haymount development south of Washington, D.C., which should ultimately include more than 4,000 housing units along with commercial development, all trees over 18 inches (450 mm) in diameter were mapped in an effort to figure out where development would have the least impact. Existing trees over 6 inches (150 mm) in diameter may only be removed with permission of the Town Architect’s office, according to the plan. Very generalized vegetation maps might be available locally or regionally, based on satellite analysis or aerial photographs. Also, critical habitat maps showing approximate locations of endangered or threatened plant species may be available from a state or regional agency.

On many sites, particularly those where extensive disturbance has occurred, the vegetation will be dominated by introduced (or invasive) plant species. Most ecological landscaping professionals argue that native vegetation is preferable to nonnative vegetation, because it is part of an established ecosystem. But agricultural uses of land are also important, and preserving agricultural lands may be a high priority for many green development projects.


Wildlife Habitat


Providing for wildlife habitat should be an important consideration with most green development projects—certainly for any in rural locations, but even for urban sites. Strategies to protect and enhance wildlife habitat go hand-in-hand with strategies to protect native vegetation and wetlands. But with wildlife habitat, the issues are often geographically broader. To provide for wildlife habitat on a particular site, it is usually necessary to examine how that site relates to the surrounding land. Because wildlife naturally moves from one place to another foraging for food and breeding, there is significant concern about habitat fragmentation. An important goal of land-use planning on a regional as well as site-specific level is to provide

contiguous wildlife corridors. Roadways and even a line of low-density development can provide imposing barriers to wildlife movement, whether white-tailed deer, box turtles, or songbirds.

Your state wildlife or fish-and-game agency may have information on wildlife habitat, but the emphasis of that research is often on game species, such as deer, wild turkey, and bear, rather than less prominent wildlife. Many states also maintain offices that address nongame wildlife, including threatened species. If that sort of information is not available from a government agency, contact your state office of The Nature Conservancy, which may compile information on threatened habitat. It is worth noting here that even urban areas can offer significant wildlife habitat. Some of the most important migratory waterfowl stopover locations are within city limits of places like Philadelphia, and ecologically rich stream corridors run through many cities.


Climate and Microclimate


Information on the local climate—temperature, insolation (solar radiation), wind, and precipitation—is critically important for the energy design of buildings. It can also be used in planning appropriate landscape plantings on a site.


Temperature

There are various types of temperature data we can use.

Design temperatures (the reasonably expected minimum winter temperature and maximum temperature) are needed to size mechanical equipment.

Heating degree-day and

cooling degree-day information tells us the overall magnitude of the heating and cooling seasons, or portions thereof. Degree-days are computed by averaging high and low temperatures each day and calculating the difference from a base temperature—in the I-P system, the standard base temperature is 65°F for heating and 75°F for cooling.

Design temperatures, as well as both monthly and annual degree-day averages, are widely available for hundreds of locations around the country. For U.S. locations, the most accessible data is from the National Climate Data Center of the National Oceanographic and Atmospheric Administration, NOAA (http://www.ncdc.noaa.gov/). Local heating degree-day information is usually available from fuel oil or propane gas companies, which use it for scheduling fuel deliveries. While these sources of temperature information are very useful, keep in mind that there can be significant variations based on elevation, topography, and microclimate. Temperatures drop with elevation (adiabatic cooling) by about 3-5°F for every 1000 feet (1.7-2.8°C per 1000 m) of elevation rise, for example, but this can be offset by the tendency of cool, dense air to flow down hillsides and collect in low-lying pockets. Orientation of a slope (aspect) also affects temperature: south-facing slopes are considerably warmer than north-facing slopes because they receive more solar radiation.

Related to temperature is information on the growing season. This can include the average dates of first and last killing frosts and the U.S. Department of Agriculture (USDA) “Plant Hardiness Zone Map,” which is widely published in garden books.


Insolation and solar access


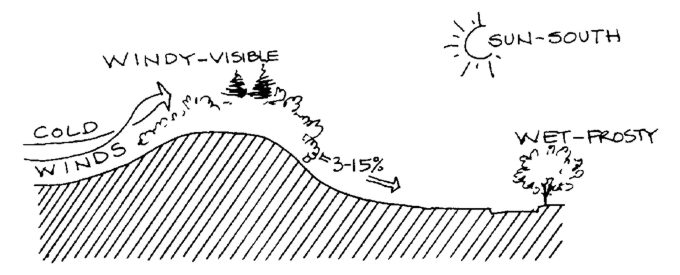
Availability of sunlight is determined both by the regional climate and by characteristics of the particular site. Regional insolation or solar radiation data is available for several hundred cities in the U.S. from the National Renewable Energy Laboratory (http://rredc.nrel.gov/solar/), and may be available from other sources, such as nearby universities and research laboratories.

Look for measured or averaged data for horizontal surfaces in Btus/square foot or Watt-hours/square meter. Information on percent sunshine or cloud cover may also be available from some sources.

Evaluating solar access is a very different process than finding out how much sunshine is available regionally. Solar access varies widely on a particular site, depending on orientation, slope, nearby topography (hills, mountains), and vegetation on the site. Relative to building design, solar access generally refers to access to the sun’s apparent path across the southern sky (in the northern hemisphere). Various devices were developed during the 1970s to simplify the task of determining solar access on a particular site, a few of which are still on the market. Solar access can often be modified significantly by shifting the planned location of a building or removing trees to the south of a building site.


Wind

Wind can be both beneficial and detrimental to the energy performance of a building, and it can determine to a great extent appropriate locations for landscape plantings. From a building standpoint, plantings can shield a building from cold winter winds, or help channel cool summer breezes into a building, helping reduce air conditioning requirements. Throughout much of North America, prevailing winds are from the west. However, even though prevailing winds may be predominantly from one direction, there are usually significant periods of time when the winds are blowing from a different direction. Plus, there is significant local variation as a result of mountains, hills, river valleys, even buildings and roadways.

Wind data is available from weather stations, airports, and some universities and research laboratories. The nearest wind data collection point will provide valuable information, as long as local (microclimate) variation is considered. One of the most useful pieces of information on wind is a wind rose. This shows graphically the amount of time prevailing winds are from the 16 subdivisions of a compass (N, NNE, NE, ENE, etc.). To be most useful, try to obtain wind rose data for different seasons, so you can see whether the prevailing winds change seasonally. For a particular site, anecdotal information from neighbors can be particularly useful. Or, wind data can be collected on-site over a period of time—because of seasonal differences, monitoring wind for a full year is ideal.


Precipitation


Unless you’re on an island with highly variable precipitation patterns—there are places in Hawaii where rainfall varies from 400 inches (10 m) per year to less than 20 (50 cm) within just a few miles—you can usually get a fairly accurate picture of precipitation averages and seasonal patterns from collection stations in the region or from the National Climate Data Center. Along with knowing total precipitation, it is important to understand how that precipitation typically falls. Is it seasonal, with 90% usually falling in the winter wet season? Does it arrive in a few deluges interspersed by long periods of drought? This information, referred to as

intensity-duration-frequency (IDF) curves, is available from the U.S. Weather Bureau (Technical Paper No. 40) and the National Oceanographic and Atmospheric Administration (Hydro-35). State highway departments and NRCS offices may be other sources of precipitation data.

Knowing the expected quantity and nature of precipitation will help you decide on appropriate plantings around the planned building(s) and also help you establish priorities regarding water conservation, graywater use for landscaping, and rainwater harvesting. In arid regions, for example, xeriscaping will be a higher priority than in wetter areas. Rainwater catchment makes sense in areas with moderate rainfall—little enough that water is a highly valued resource, but enough (and spread out enough) that it can be depended on for the planned uses. According to some experts, rainwater harvesting makes the most sense when precipitation is between 15 and 30 inches (40-80 mm) per year. If storm events are severe but spread far apart, the landscape plan needs to address stormwater management and infiltration very carefully to avoid significant downstream impacts. Finally, in colder climates, expected winter snowfall needs to be considered relative to building design and plantings.


Humidity

The final climatic condition we will address here is relative humidity—how much moisture is in the air relative to the maximum amount that the air could hold. In buildings, humidity is an important determinant of comfort and a condition that needs to be considered in selecting cooling strategies and equipment. In low-humidity areas, for example, evaporative coolers provide a cost-effective air conditioning strategy, but they don’t work well in humid climates. Similarly, the strategy of opening a building up at night and closing it during the day in the summer for natural cooling is less effective in very humid areas where moisture-laden nighttime air can result in mildew problems or require use of dehumidification equipment.


History of the Land Use


While this article focuses primarily on physical, climatological, and ecological aspects of a property, the historical influences can also be an important factor in site planning and design decisions. Past human influences need not be ignored; in some cases they should even be celebrated. What existed on the site previously? Is there evidence of previous settlement? What stories do the old stone walls winding through a New England woodland tell? What is the history of an adobe home ruins on a Southwest mesa? There may have been wisdom in the way an early carriage path crossed a piece of land, as evidenced by an ancient row of trees and subtle depression in a hillside. The placement and orientation of early settlers’ homes, as evidenced by the remaining ruins, can tell us volumes.

Information on the history of a piece of land can be elusive but fascinating. It can take you to early land deeds, discussions with old-timers still in the area, published histories of the region, historical society libraries, and on-site investigations. A number of prominent green development projects have made extensive use of archaeological investigations to learn about the history of the land use, even prior to European settlement.


Aesthetics and Views


Along with considering orientation and building siting from an energy standpoint, we need also to consider views that the building will provide. Green building is, in part, about celebrating nature.

Designing a building to make it easier for the occupants to appreciate their surroundings may increase their motivation to protect or restore the land around them. How will the building placement on a property impact the views and aesthetics of the land? When Brattleboro, Vermont landscape architect Monroe Whitaker, of Stevens Consulting Engineers, walks a piece of land with property owners planning to build, he always asks what it is they particularly like about the property. Very often he finds that it is the views of the land. When they get to the point of siting a home on the land, he asks them to think about how that building will affect their appreciation of the land. It is not uncommon for him to find that the envisioned home will destroy just what the property owners most love about the land—because the house would sit right in the middle of the open meadow that dominates the viewscape. Through this envisioning process, Whitaker helps them find a building site that will preserve the aesthetic qualities of the land that initially attracted them to it. Walking the land—in all times of day and year—is the best way to learn what it holds from an aesthetic standpoint.


Toxics Inventory


On any piece of land where there has been significant use over the past hundred years, it is a good idea to investigate whether toxic materials might be present. Old farm dumps can contain corroding barrels of highly toxic pesticides. Old autos can leak oil, gasoline, antifreeze, and other fluids into soils, surface waters or groundwater. An abandoned electrical transformer could be leaking PCBs. Discarded automobile batteries can release lead into the environment. In extreme cases, the discovery of hazardous waste on a property can result in thousands of dollars of expense in clean-up.

Inventories of known hazardous sites exist and are available from state agencies that deal with pollution control. Unfortunately, most of the farm dumps and other minor sources of toxics are not documented in published inventories. In most cases, a careful walking of the land will determine whether there is enough concern about toxics to warrant a more thorough investigation. If there are no apparent signs of a dump, past industrial activities, or other red flags, then it is probably not necessary to go any further. If areas of potential concern do show up, they should be investigated by a qualified environmental engineer. If remediation is necessary, the environmental engineer should be able to advise you on how to proceed, and put you in touch with relevant agencies to help you come up with a workable plan. (More complete discussion of development on brownfield sites will be provided in a future issue of

EBN.)


Integration with Surrounding Region

A building site is not an entity unto itself, but rather part of a broader built and unbuilt environment. An important part of site assessment is examining how this particular property—and the buildings on it—will relate to surrounding sites and the region. Cudnohufsky stresses that part of the analysis of a site needs to be its connection with the area. “Don’t forget to look outward from the site,” he told

EBN. “There is a different relationship on each boundary of the property.” Consider the connection with nonfragmented wildlife habitat on abutting lands, protection of regional surface waters and wetlands, and integration with regional transportation systems that provide alternatives to automobile travel. Are there bicycle trails and pathways that can be linked to? Are there public transit options that people living or working at the site can use?

To examine local and regional planning issues, contact a town, county, or regional planning agency and get hold of relevant planning documents, such as a town plan or regional plan. Talk to the planning director for the municipality, if there is one, or attend meetings of the planning commission with jurisdiction to get a sense of their priorities relative to planning. Not only can this help you figure out how to make sure your project will fit into the surrounding area better, but it can streamline approvals that may be required for your particular project.


Regulatory Constraints


The best plans for a green development project may not pass muster with local zoning regulations. Very often, the strategies that make the most sense from an environmental standpoint—such as clustering buildings on a small portion of a site and keeping the rest undeveloped—do not comply with zoning regulations. Therefore, a careful examination of relevant land-use regulations should occur while site planning and design are proceeding. The local zoning administrator or planning office staff can generally help you in interpreting these regulations. It often makes sense, however, especially for larger, more complex projects, to hire a qualified landscape architect or civil engineer for help in understanding and complying with (or seeking exemption from) relevant regulations.


The Next Step: From Site Evaluation to Site Plan

Collecting information about a potential building site is only the first step. From this information can evolve a site plan and specific building design elements that are based on what the land offers—both opportunities and constraints. Cudnohufsky suggests carrying out three different mental tasks in the process of getting to know a place:


inventory components of the site (find out what is there),

describe each key component of that inventory with the aim of discovery or seeing as fully as possible (largely adjectives), and

interpret the discoveries separately in light of your prime aim or programmatic goal. Through this, he says, “you begin to see solutions that are in concert with the process.” He might use this process as follows:

•Inventory: Grove of mature red oaks.

•Description: 12 trees, 15 to 20 feet apart, 70 to 80 feet tall with unified canopy, densely branched with sculptural interest, good health, 28” to 45” caliper, low branching, dense and uniform foliage.

•Interpretation: Retain, protect to drip line during construction, and feature as central element in proposed medical center courtyard.

To be most effective, site evaluation should have a finished product. Create a map or series of maps, and summarize major findings in writing. This will make the information more usable in the discussion and decision-making processes. Finally, the importance of bringing in a landscape architect or designer very early in the overall planning and design process cannot be overstated. The land should inform the building design and landscaping plan right from the beginning.


Published March 1, 1998